In the Spectrum View window, which appears in
1/1 Octave or 1/3 Octave functions, you can select
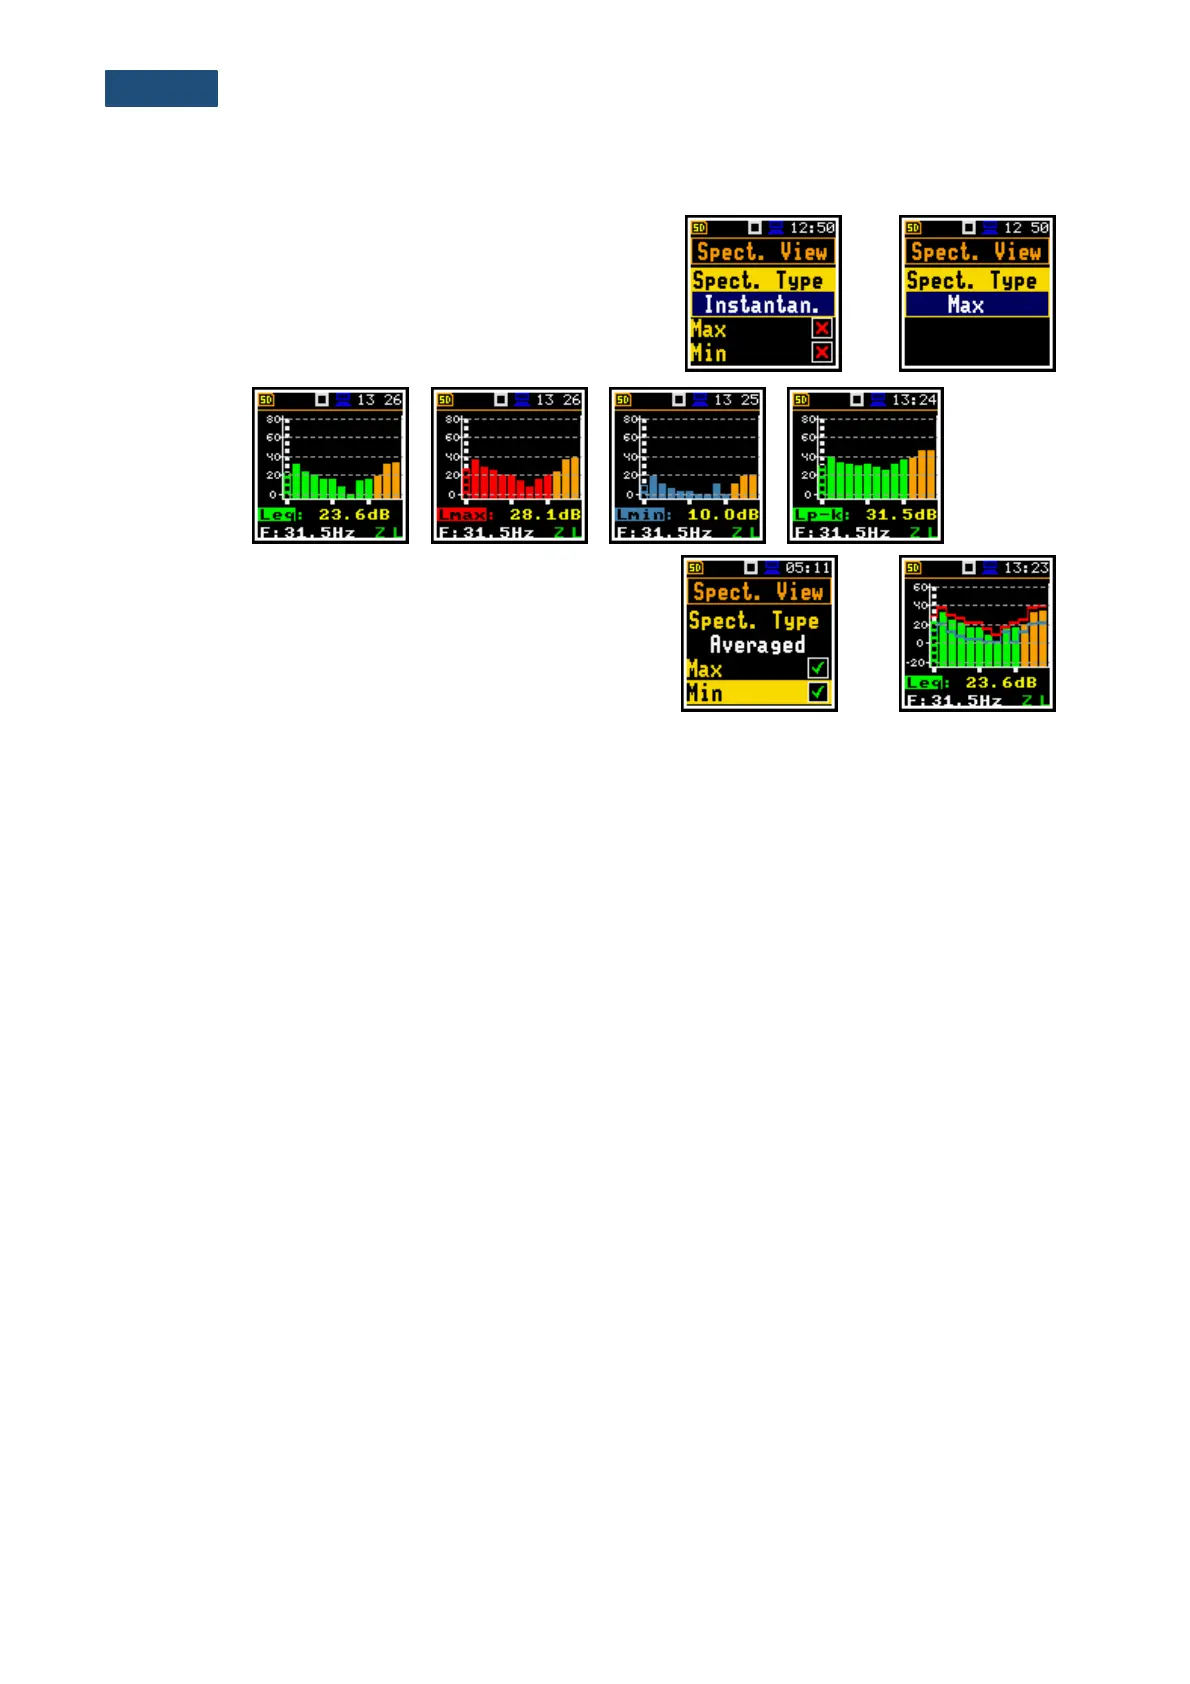
different spectra to be visible on the display
(Spect. Type): Averaged, Instantaneous, Max, Min
and Peak.
Below are views of different spectra.
Minimum and maximum spectra can be presented at the
same plot with the Averaged and Instantaneous
spectrum when the Max or/and Min parameter is
switched on.