The averaging of results for each spectrum band is performed during the
Integration Period and is repeated the Repetition Cycles times.
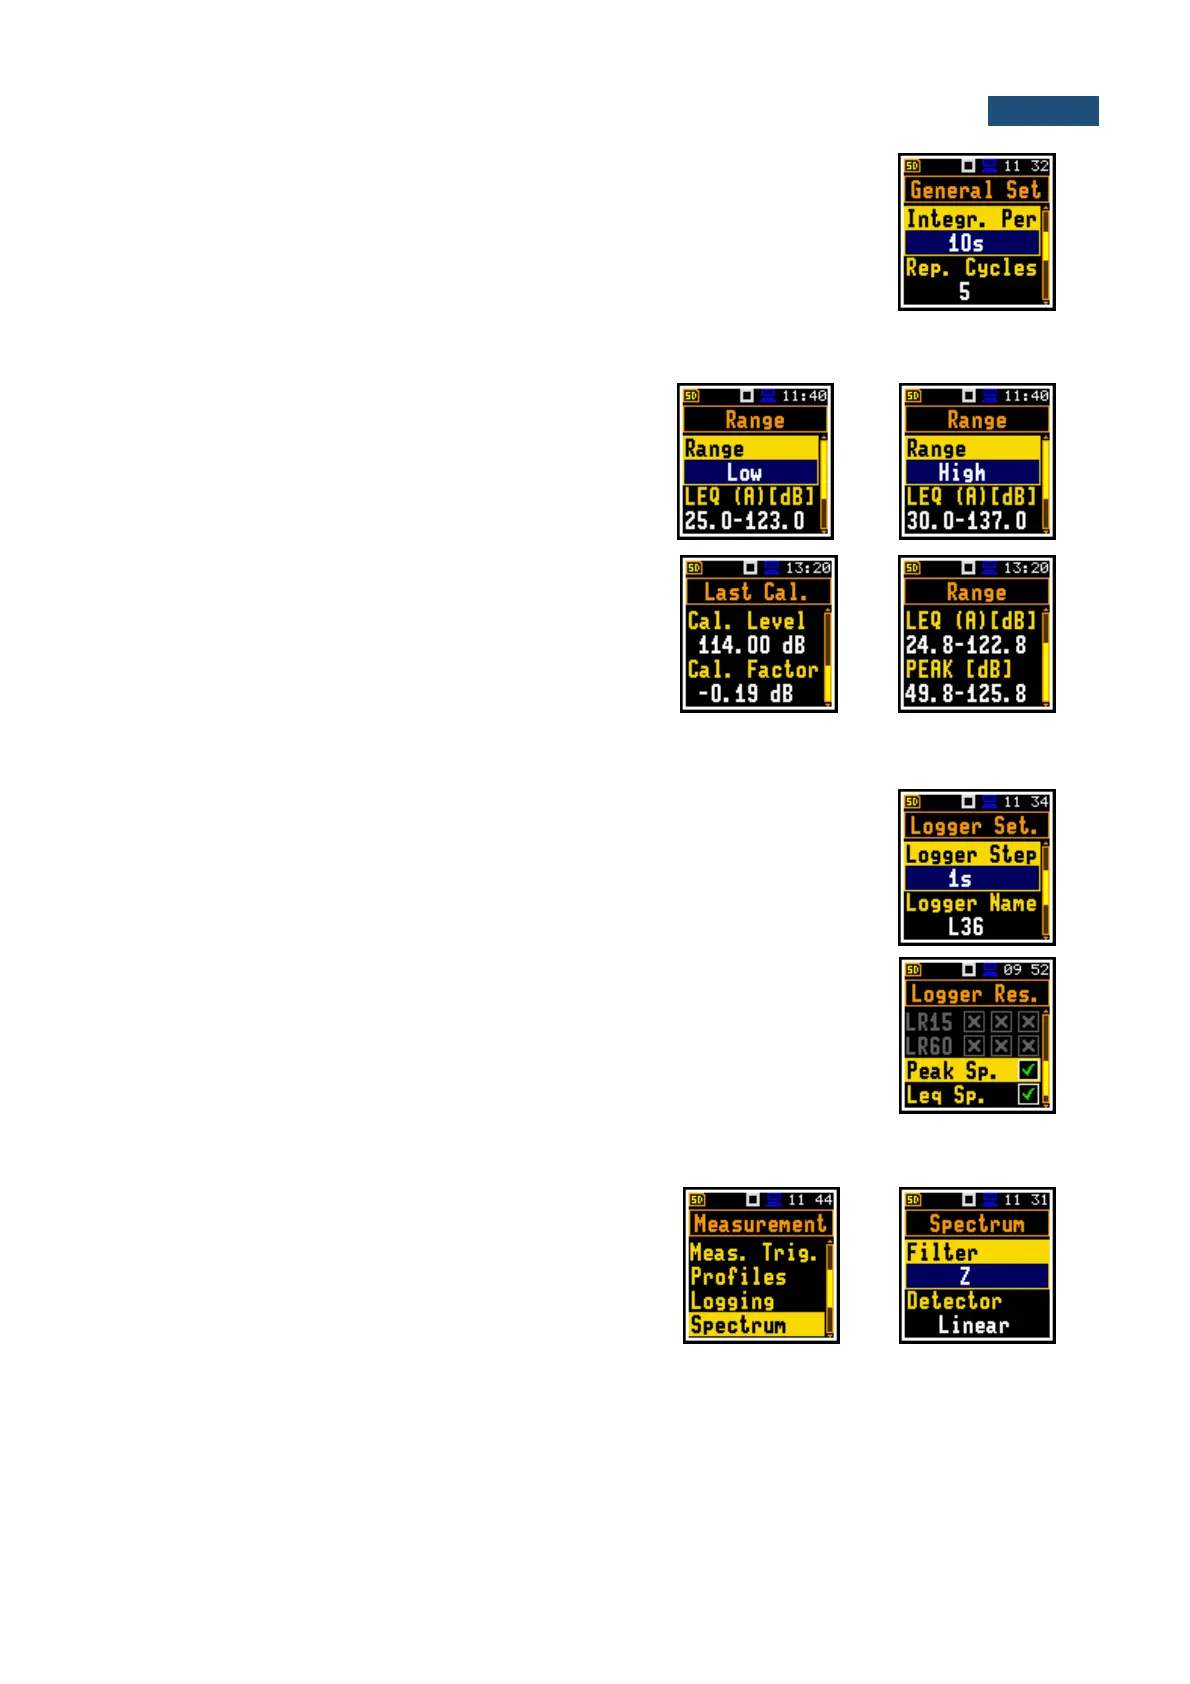
Both parameters are defined in the General Settings list.
11.2.1 Selecting the measurement range for the 1/1 and 1/3 octave analysis - Range
For the 1/1 Octave or 1/3 Octave functions you can
select the input ranges specified in Appendix C, named
as Low and High.
The selection of the input range is made in the Range
window of the Measurement list.
The above screens were made with calibration factor
equal to zero. The calibration factor is always added to
the upper range level – see example.
11.2.1 Logging of 1/1 and 1/3 octave spectra – Logging
Spectra are always logged together with Summary results in a logger file with
Integration Period step. The first condition should be fulfilled, namely the Logger
must be switched on (path: <Menu> / Measurement / Logging / Logger Setup /
Logger: On).
The Leq and Lpeak results from 1/1 Octave or 1/1 Octave analysis can also be
saved in the logger file with the step defined by the Logger Step parameter (path:
<Menu> / Measurement / Logging / Logger Setup). The enabling of spectrum
saving in the logger file is made by checking the Peak Spectrum or
Leq Spectrum position with the ◄ / ► key.
11.2.2 Setting up the parameters of 1/1 and 1/3 octave analysis - Spectrum
For active 1/1 Octave or 1/3 Octave functions the
additional position (Spectrum) appears on the
Measurement list.
The Spectrum position enables selecting the pre-
weighting broadband frequency filter and LEQ detector
for the octave or third octave analysis.
Following weighting filters are available for the 1/1 and 1/3 octave analysis:
• A class 1 according to the IEC 651 and IEC 61672-1:2013 standards,
• C class 1 according to the IEC 651 and IEC 61672-1:2013 standards,
• Z class 1 according to the IEC 61672-1:2013 standard,
• B class 1 according to the IEC 651 standard.
Filter characteristics are given in Appendix C.