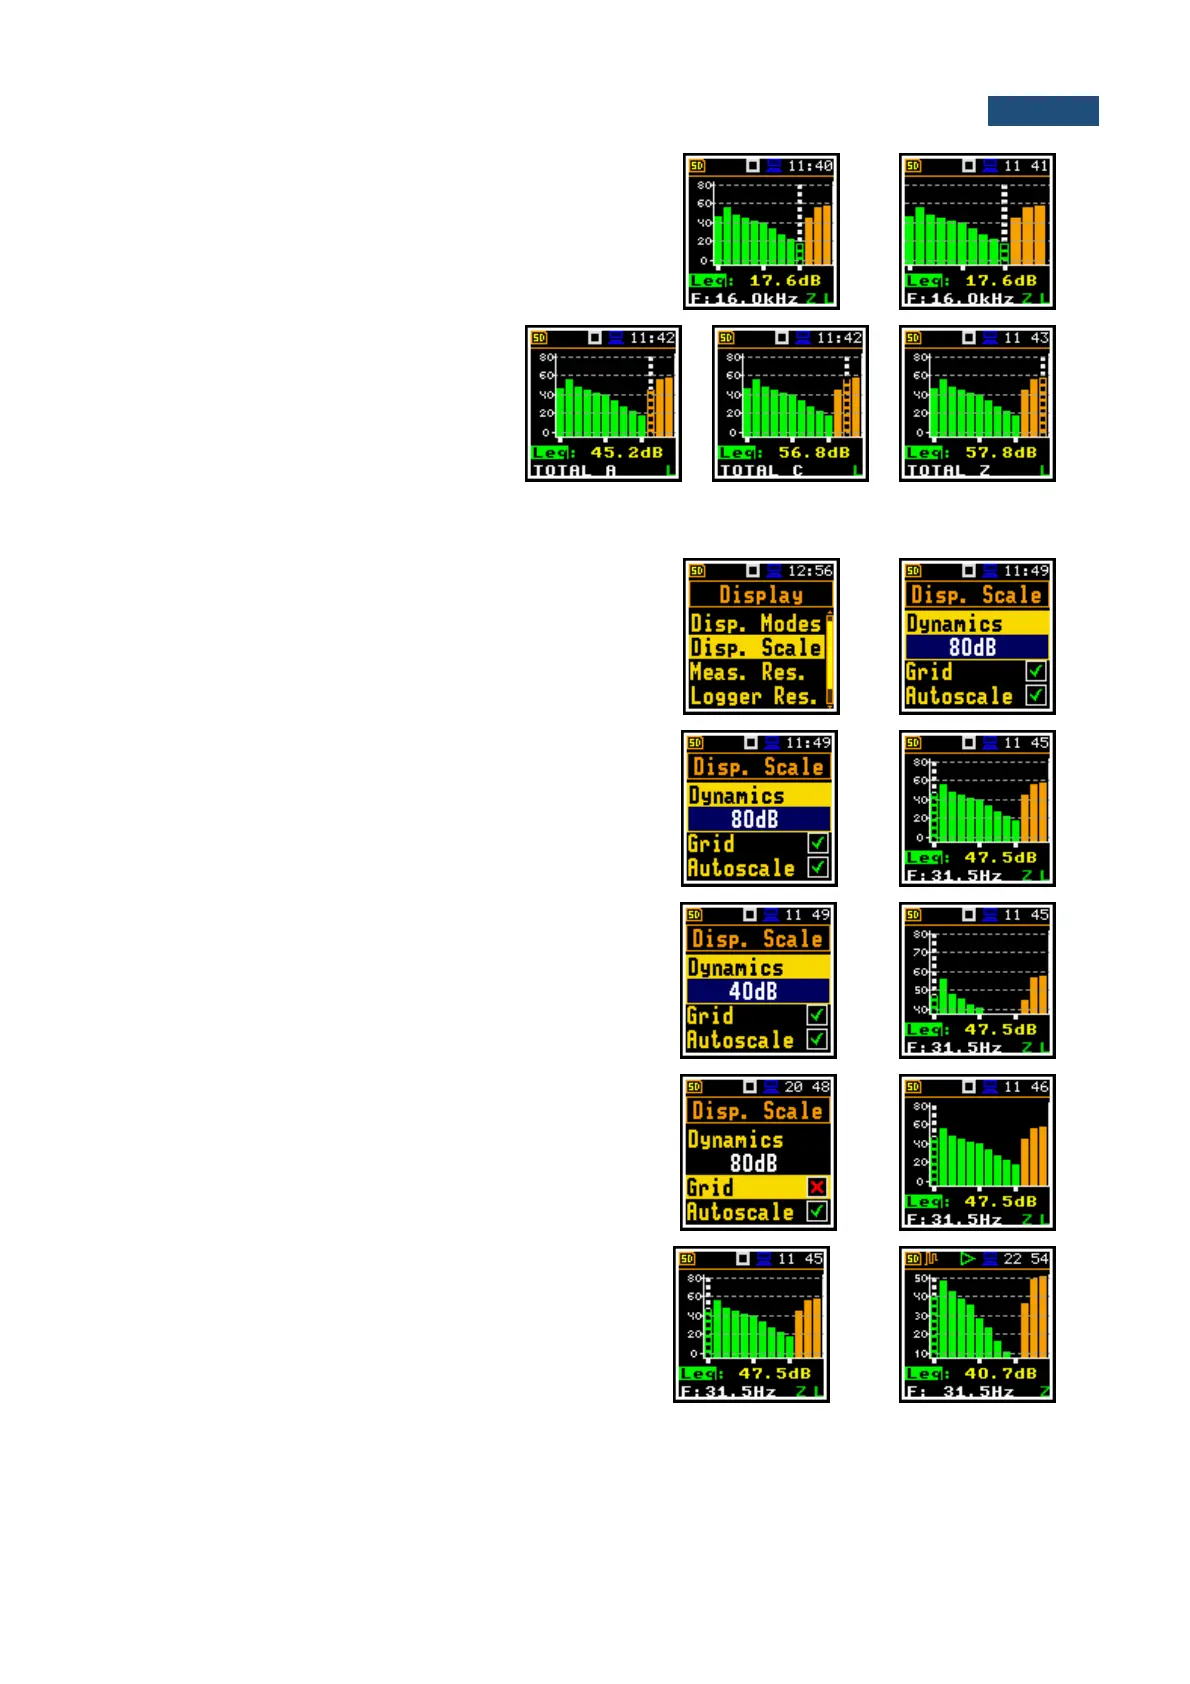
Spectrum view can be changed with the <Enter> key.
Second spectrum view doesn’t have the Y scale and thus
has wider bars.
Total values are calculated with the
filters A, C and Z, and are displayed at
the bottom line of the screen when the
cursor has been placed on the
appropriate orange bar.
11.3.2 Adjusting scales of the spectrum plot – Display Scale
The Disp. Scale position allows you to change the scale
of the spectrum plot and switch the grid and automatic
scale adjustment on/off.
Scaling the vertical axis
The Dynamics position enables selecting the required
scale dynamic range of the spectrum plot. It is possible
to select the range from the set: 10dB, 20dB, 40dB,
80dB and 120dB.
Switching the grid on/off
The Grid position switches on or off the grid in the
spectrum view.
Switching on/off the automatic Y-scale adjustment
The Autoscale position switches on or off the automatic
adjustment of the Y-axis scale dynamic range to the
current spread between lowest and highest measured
octave or third octave results.