6 CONFIGURING DATA VIEWING – Display
The Display section contains elements for programming
measurement result views and display parameters.
The content of the Display list depends on the selected
measurement function.
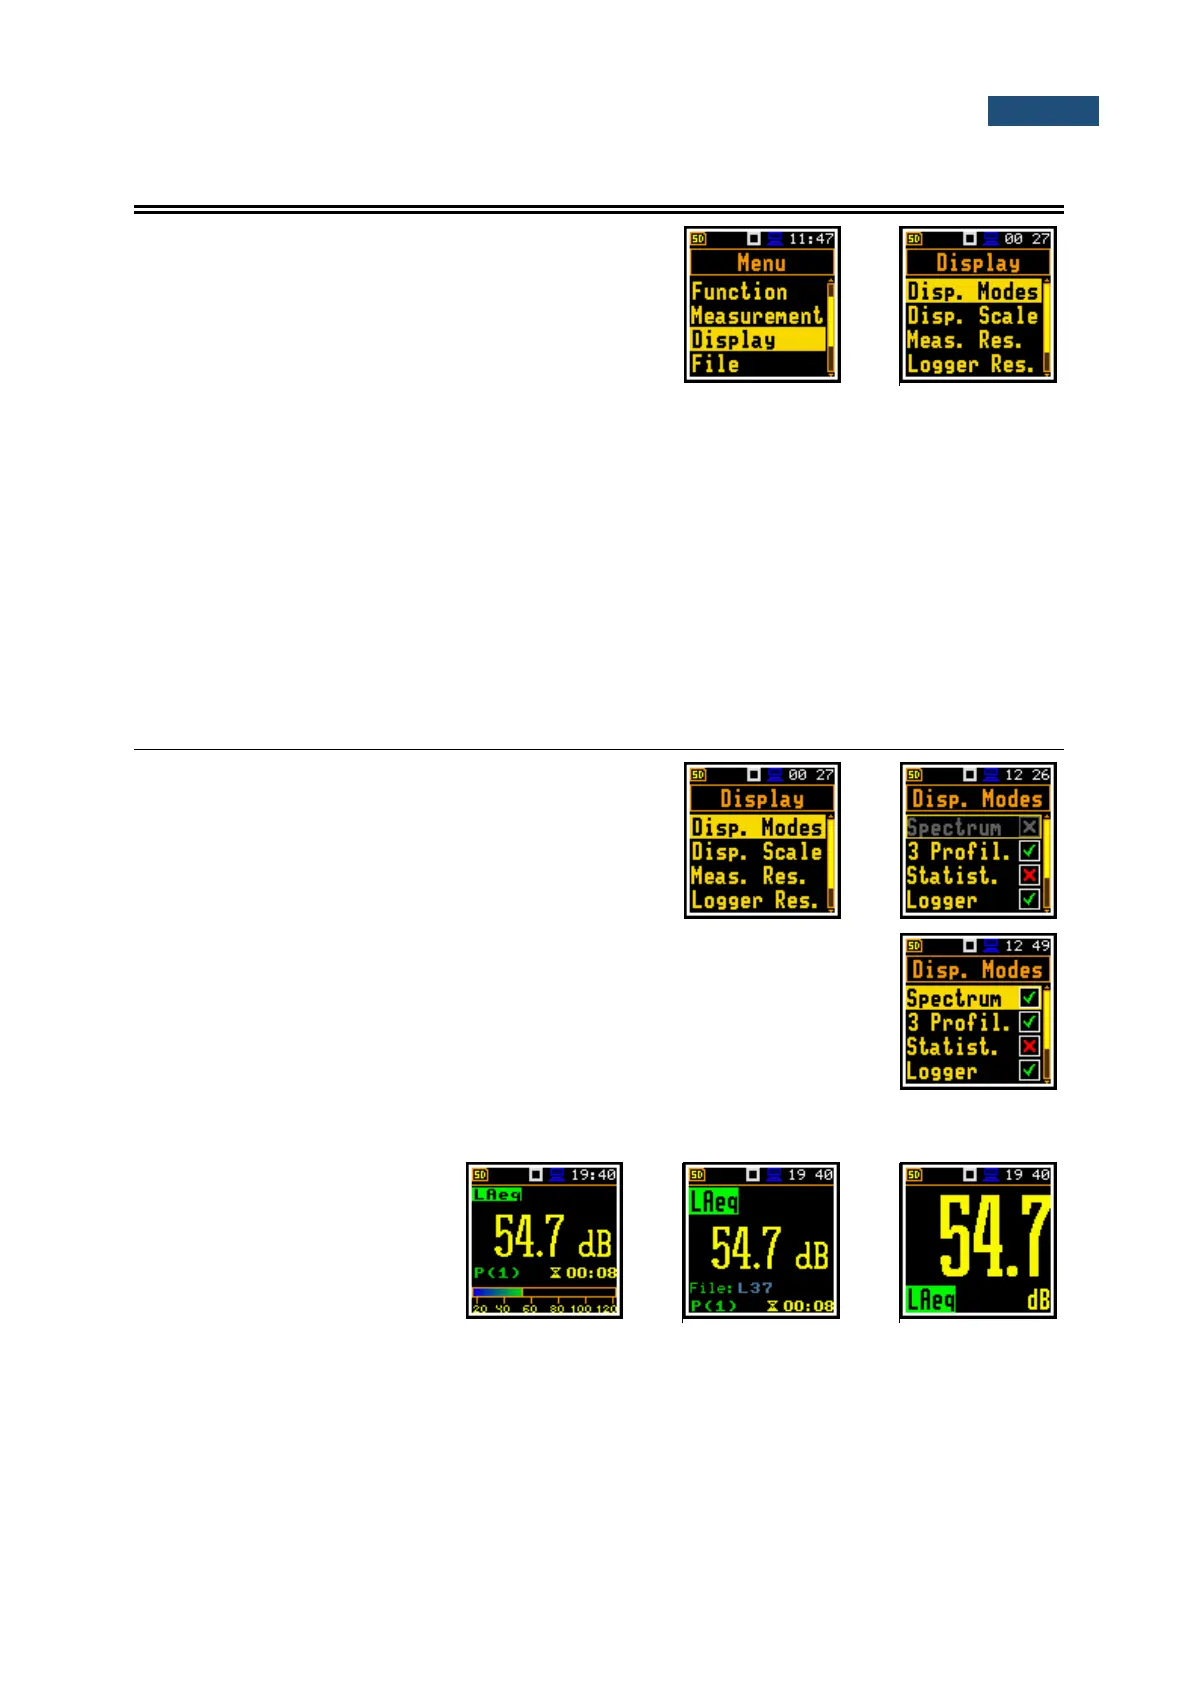
The Display section contains following items:
Disp. Modes allowing to define active modes of the measurement results presentation;
Disp. Scale allowing to adjust the scale in the graphical modes of the measurement results
presentation;
Spect. View allowing to select spectra to be viewed. This position only becomes available in
the 1/1 Oct. and 1/3 Oct. modes;
Meas. Res. allowing to select measurement results to be displayed;
Logger Res. allowing to select time history results to be viewed as a plot;
Screen Set. allowing to switch rotation of the screen on/off and set the energy saver function.
6.1 ENABLING DISPLAY MODES – DISPLAY MODES
The One Result view mode is always active. Other
display modes can be enabled or disabled in the
Display Modes screen.
You may switch between those results view modes, that
were enabled in the Disp. Modes screen.
In the Lev. Met. function, following display modes are available: 3 Profil., Statist.,
Logger, Run. SPL and File Info.
In the 1/1 Oct. and 1/3 Oct. functions, additional mode (Spectrum) becomes
available.
6.1.1 One Result display mode
In the One Result display mode,
any measurement result,
selected in the Disp. Res list,
may be viewed.
One Result mode may have
different views. The user may
change the view of one result
mode by pressing the <Enter>
key.