6.1.4 Statistics presentation mode
“Statistics” is the cumulative probability density function of exceeding the noise level during the
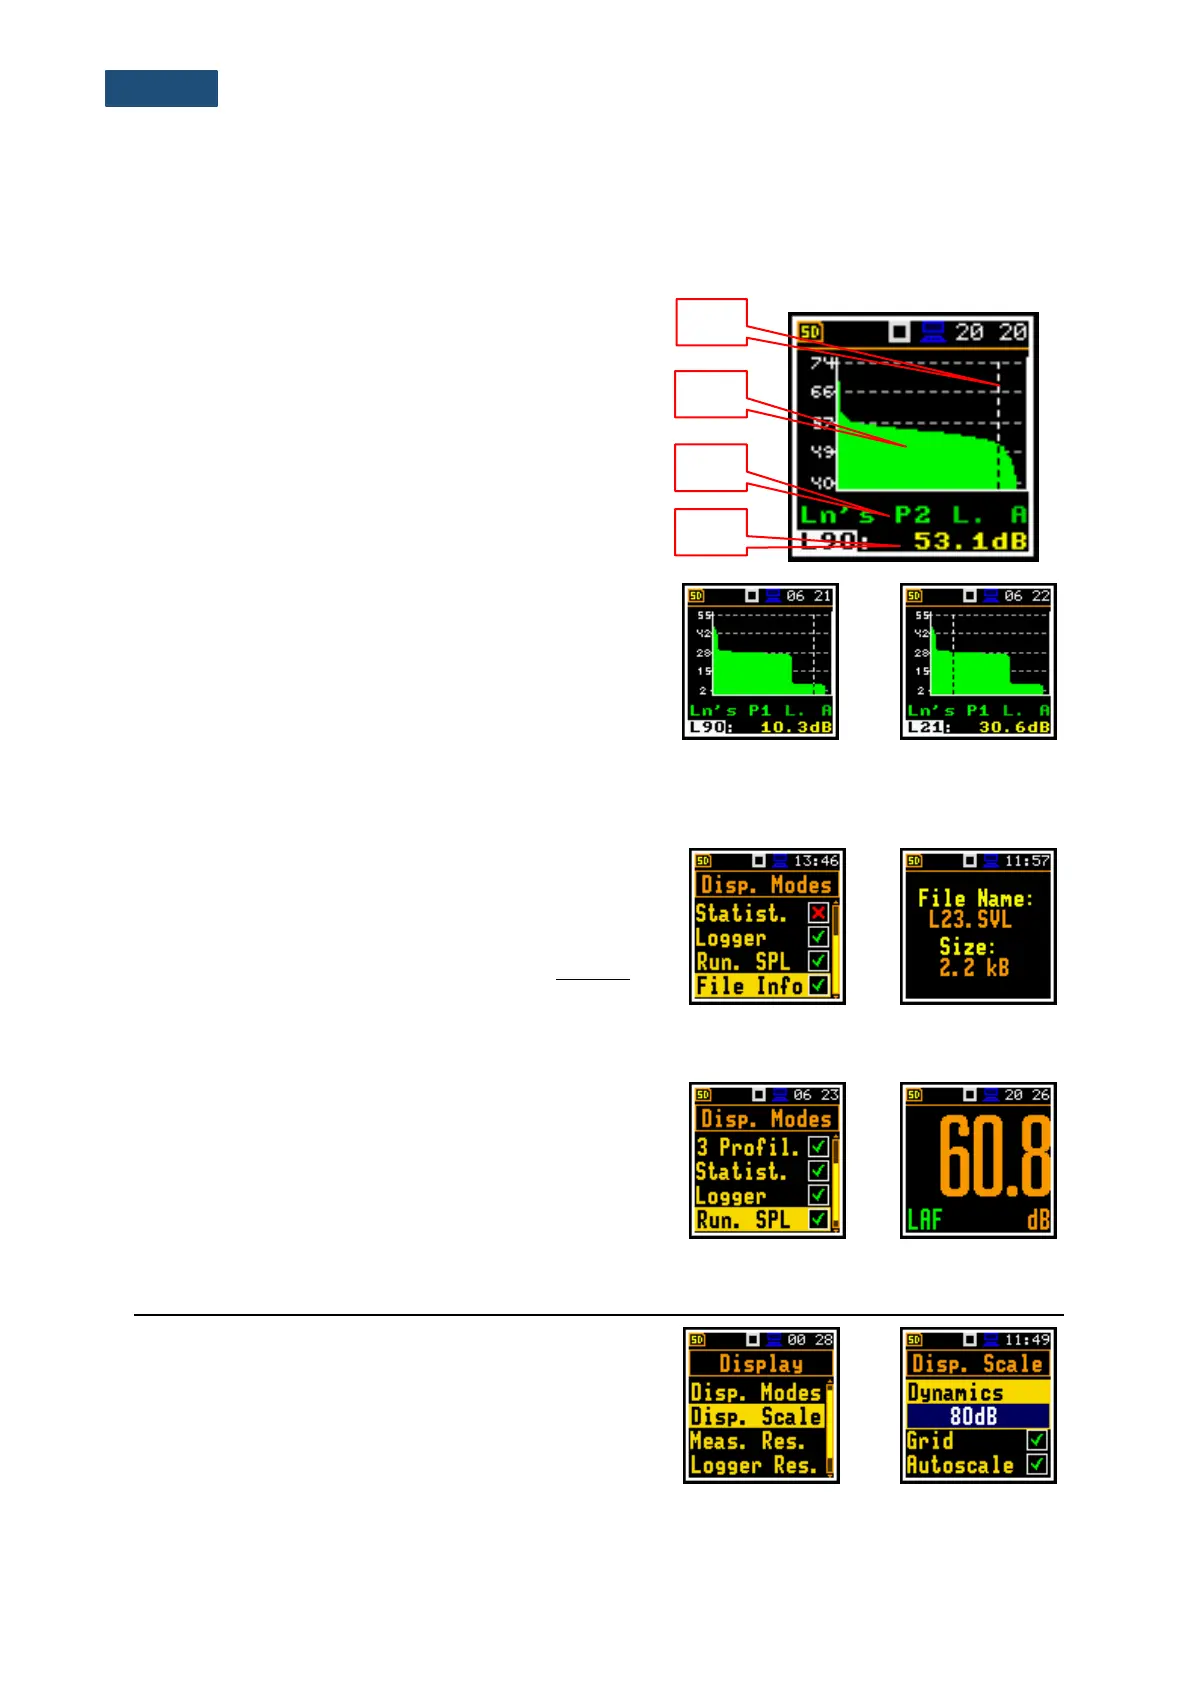
measurement period. The X axis defines the probability of exceeding the noise level, statistical level Lnn,
and the axis Y defines the calculated noise level in dB.
Field description of the Statistics view
1. Cursor position
2. Statistics plot
3. Result name, active profile, LEQ detector (Linear,
Fast, Slow or Impulse), used weighting filter name
(A, C, Z or B)
4. Value of the selected statistical level Lnn and units
(dB)
Fields on the plot can be selected with the ▲ / ▼ key.
When field is selected, its value can be changed with the
◄ / ► key pressed together with <Shift>.
When the Lnn field is selected you may change the
cursor position with the ◄ / ► key. The statistical level
and the appropriate value are presented in the line below
the plot.
6.1.5 File information display mode
The File Info position enabling additional display mode
with information about the logger file.
The File Info screen indicates the file name and its size.
When Logger is Off (path: <Menu> / Measurement
/Logging / Logger Set) the File Info position is disabled.
6.1.6 Running SPL display mode
The Run. SPL display mode shows the SPL result when
measurement is not currently running. In this mode, SPL
result is calculated and displayed, but not stored in the
instrument's memory. The purpose of this mode is to give
the user a first indication about the signal to be measured.
This can be useful for the correct selection of the
measurement range.
6.2 ADJUSTING SCALE AND GRID OF THE PLOT – DISPLAY SCALE
The Disp. Scale list of parameters enables adjusting the
scale of the plot and switching a grid on/off in the Logger,
Statistics or Spectrum display modes.