67
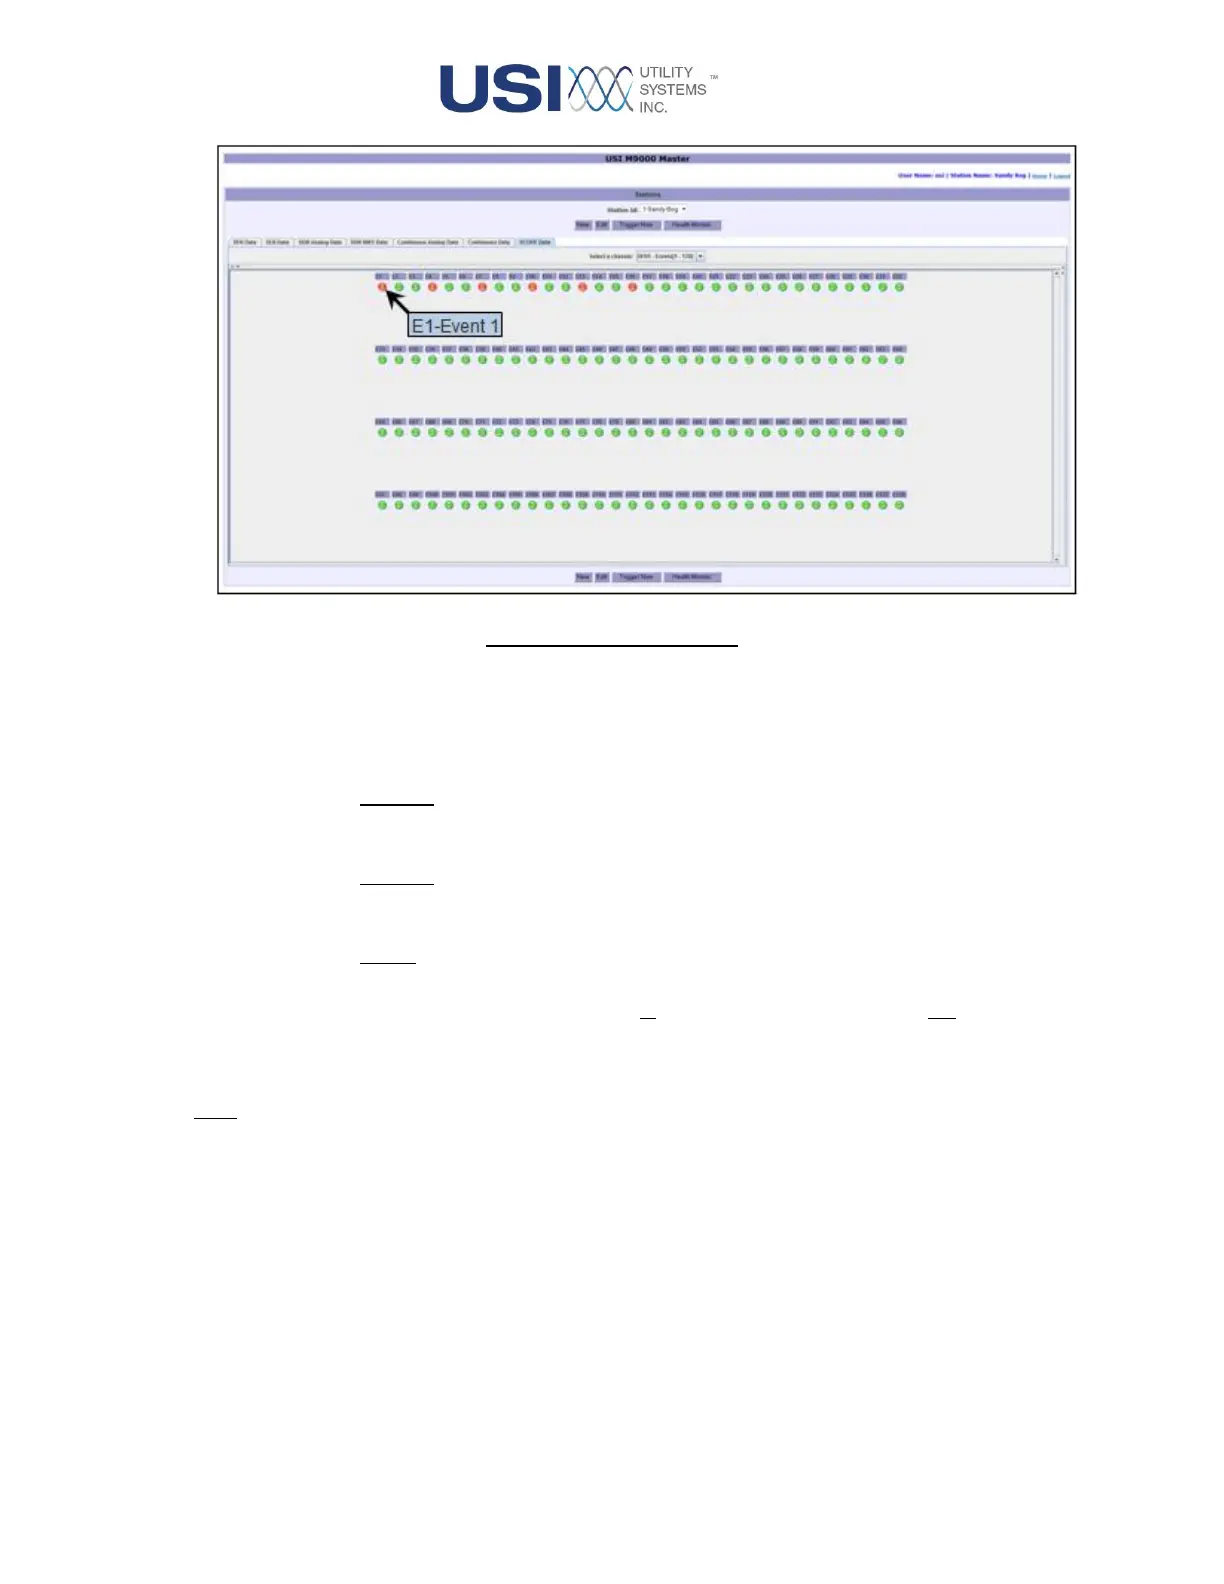
Figure 2-36 Status Panel
• Waveform Panel
This panel plots data and displays the calculated meter values of the selected analog
channels. It also provides the following features:
o X-Scale:
The values in this scale are the A-to-D sample numbers.
o Y-Scale:
The values in this scale are the sample magnitudes. This scale is auto-ranging.
o Zoom:
This feature is an X-Y zoom. To exercise this feature, left-click and drag a box
around the area to zoom (zoom in by dragging left-to-right; zoom out by dragging
right-to-left).
Note: Hover the mouse pointer over a meter value to display its description.
• Scope Data Control Panel
This panel provides the following controls: