INSTRUMENT OPERATION MODES
5-21
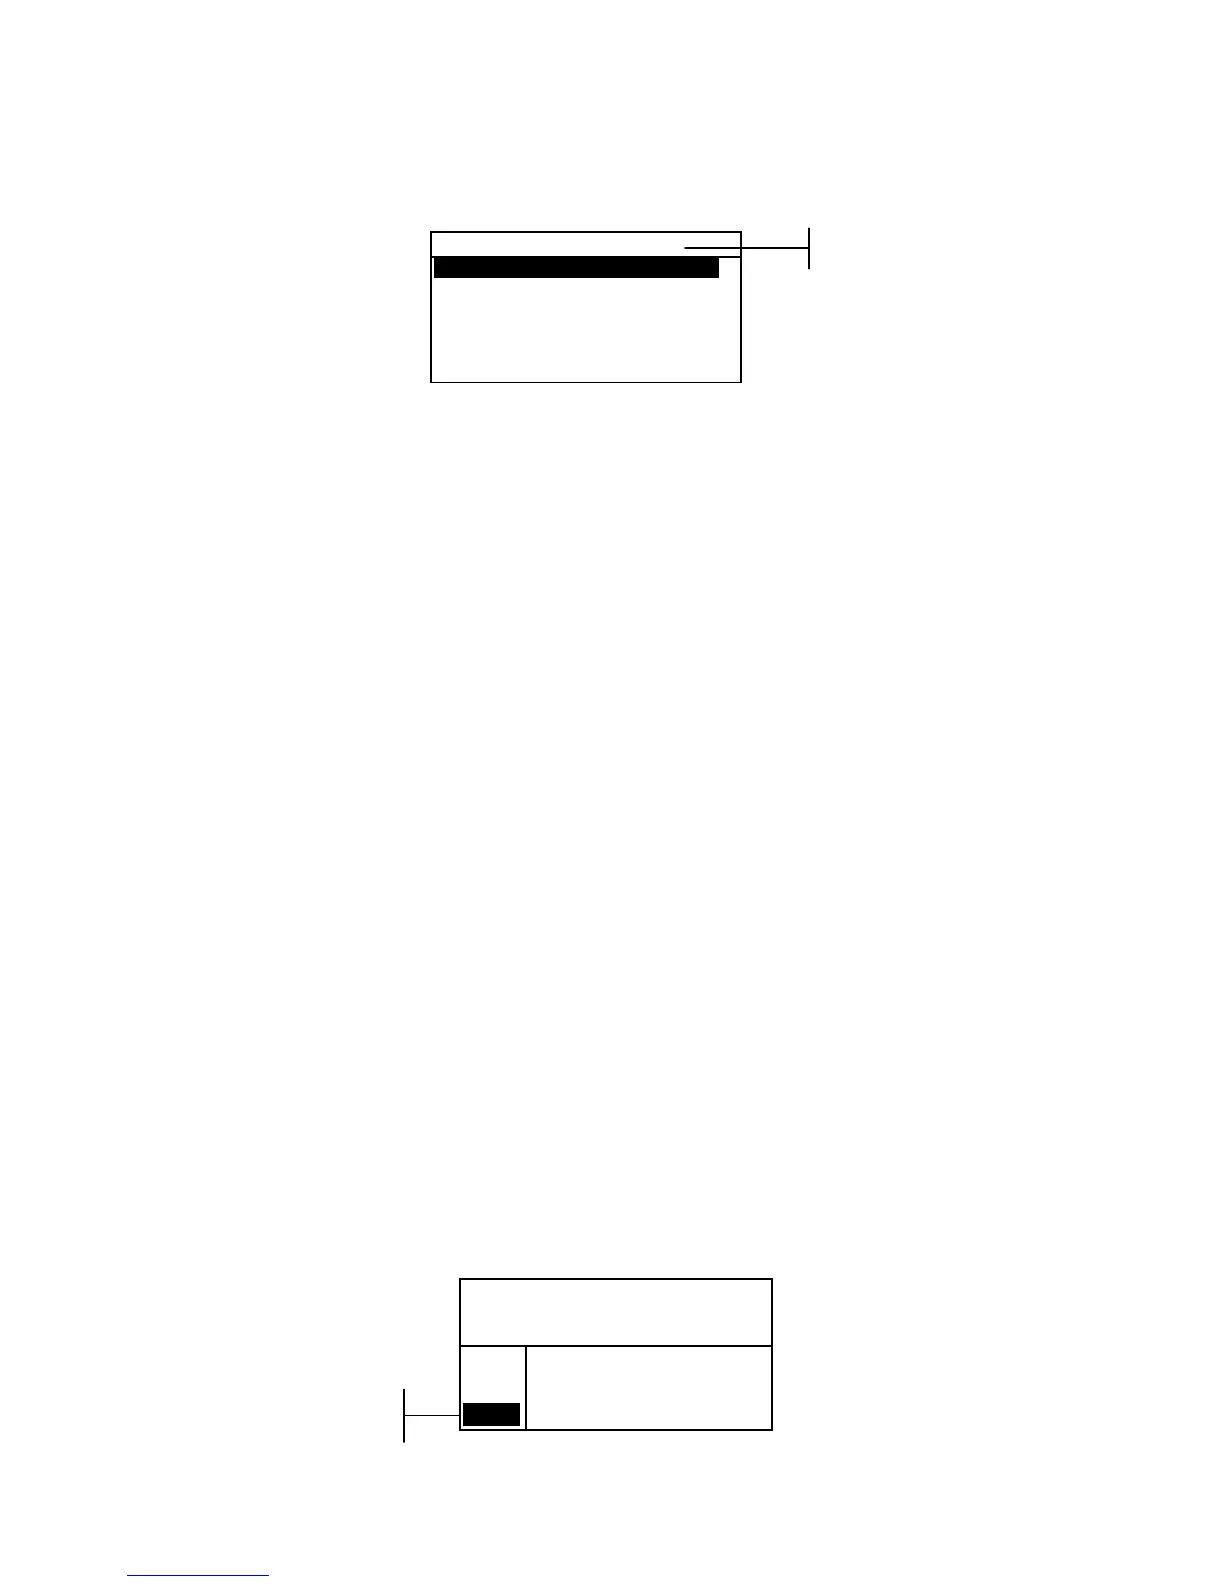
3. Press the Enter # key to open the Tools menu.
Tools – Sample 9
Transmit This Sample
Transmit Proj Sample
Transmit All Samples
Delete This Sample
Delete Proj Samples
Delete All Samples
Transmit This Sample
Transmits the current sample data out the serial port.
Transmit Proj Sample
Transmits all samples that exist in the current project.
Transmit All Samples
Transmits all samples stored in the instrument.
Delete This Sample
Deletes the current sample from the database.
Delete Proj Samples
Deletes all samples attached to the current project.
Delete All Samples
Deletes all samples stored in the database.
4. Use the Tab keys $@ to highlight the desired tools option
and press the Enter key #.
5. Use the Tab keys $@ to highlight
Yes and press the Enter
key # to initiate the selected tools option.
Viewing the Reflectance Graph
The instrument can display reflectance graphs for the standard
and sample at the same time. Reflectance values (actual or
difference) are displayed in 10nm increments, from 400 to 700
nanometers.
Measurements can be taken with the reflectance graph
displayed in Analyze and Compare mode.
To view a reflectance graph:
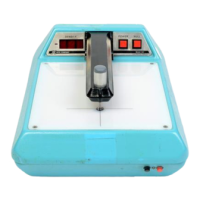
1. Use the Tab keys $@ to highlight the reflectance curve.
Proj 1: PROJECT A
Std 1: STANDARD A
Sample: #9 9:51
L*a*b*
D65/10
.
.
..
.
.
.
...
ΔL* +0.05
L* 88.25 Δa* —0.03
a* —4.71 Δb* —0.14
b*+36.64 ΔE* 0.16
2. Press the Enter key # to display the reflectance graph.
Selected sample
Reflectance
curve