80 Installation, Operation, and Maintenance
Part 2, Operation
3 Introduction to Operation
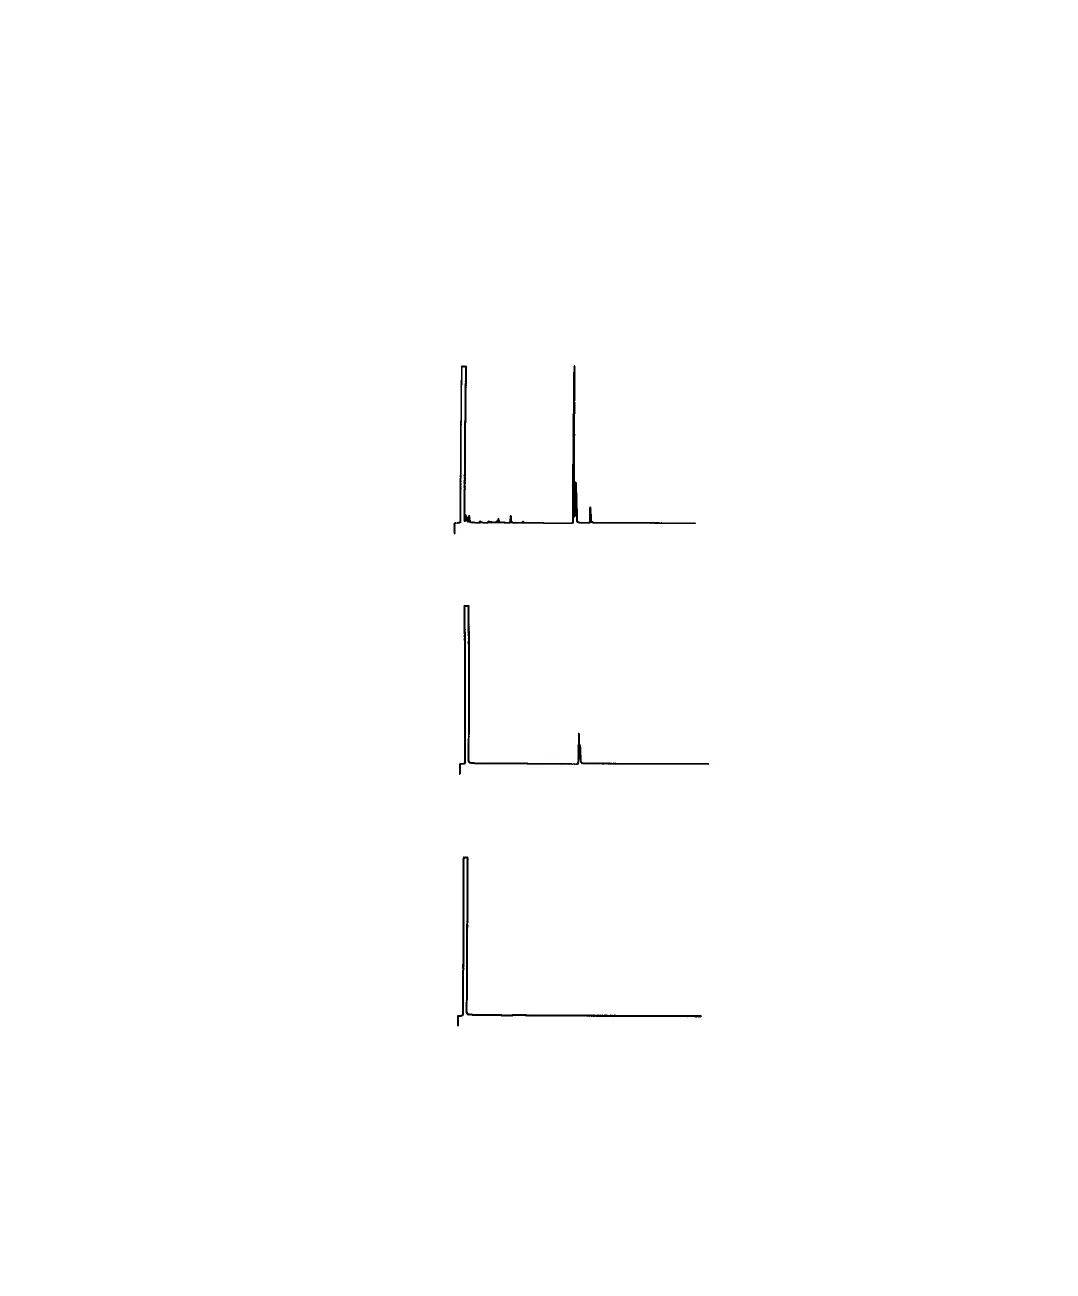
Chromatograms A and B (Figure 36) show the effect of carryover when 1 µL
from a vial of methanol is injected after 1 µL from a vial of a solute dissolved
in methanol. The peaks in chromatogram B are from the solute left in the
syringe from the first injection.
Chromatogram C shows the result of washing the syringe with four 80%
syringe volume solvent washes. The carryover peaks disappear.
Figure 36 Sample carryover
Chromatogram A:
20 mg/mL of solute
in methanol
Chromatogram B:
Methanol blank
without washes
Chromatogram C:
Methanol blank
after four washes
 Loading...