A112101 PD Analyzer Function Card (Option)
7.6.3 Statistical Result
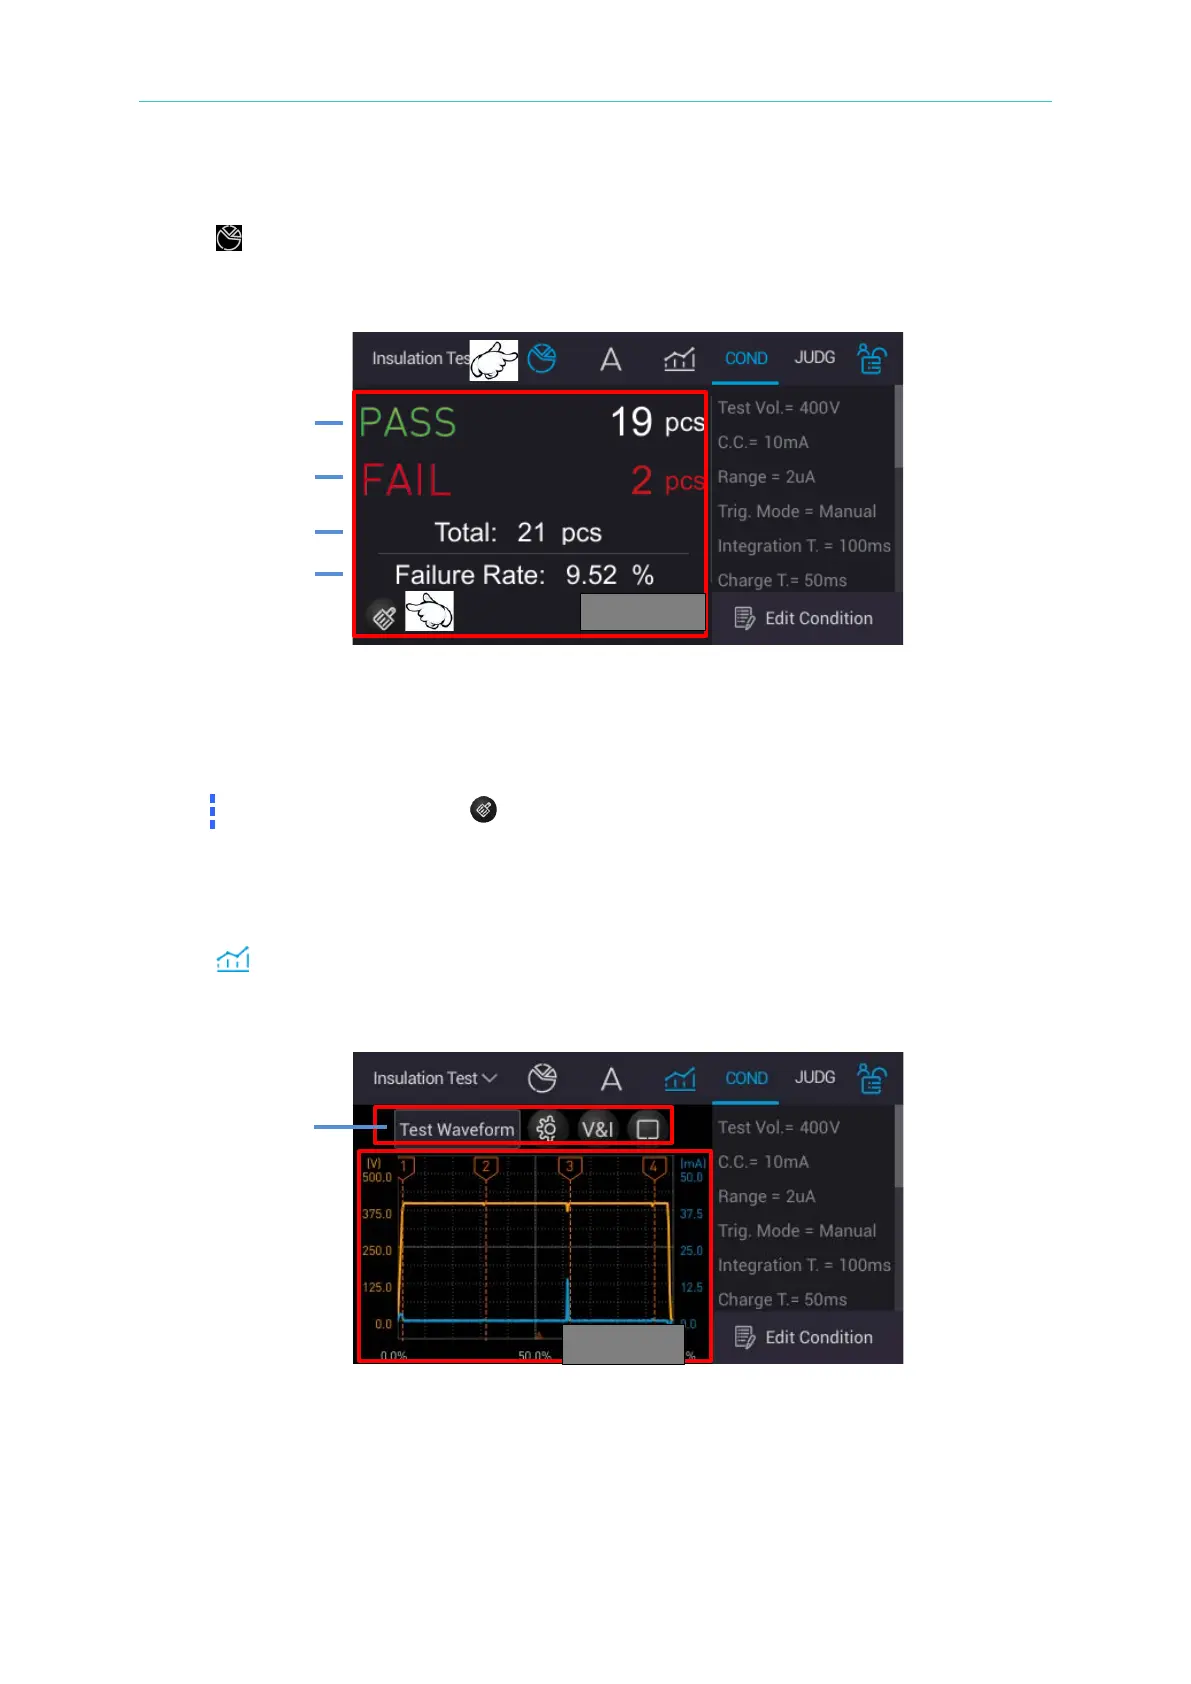
Select “ PIE chart (statistical report)” in the main menu and press the green “START”
button on the panel to perform measurement. The display area below shows the “PASS” and
“FAIL” counts.
1. PASS: DUT “good product” accumulated count
2. FAIL: DUT “no good product” accumulated count
3. Total: It displays the test completed DUT total count
4. Failure Rate: It displays DUT’s failure rate
Long press for 1 second : All statistical counts are zeroed.
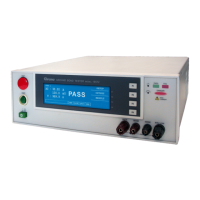
7.6.4 Waveform Result
Select “ run chart (analysis graph)” in the main menu and press the green “START” button
on the panel to perform measurement. The display area below shows the entire measured
waveform result (including voltage and current).