GE Analytical Instruments ©2016 125 of 270 DLM 68100-09 EN Rev. A
Chapter 6: Analyzer Operation
• Start Analysis button — Press this button to initiate measurements with the most current Analyzer
settings. After analysis begins, the button changes to Stop Analysis.
• Trend or Peaks button — When making Online measurements, press the Trend or Peaks button to
toggle the display between a graphical view of the most recent seven days of measurement results
(Trend) and a graphical view of the CO
2
peaks produced during each measurement (Peaks).
• S1, S2, S3, S4, and S5 tabs — When making Online measurements, select any of these tabs to display
peaks or data from each enabled stream.
• CS tab — When making Online measurements, select this tab to display peaks or data from the Check
Standard, if it is enabled.
• Current tab — Select this tab to see the CO
2
peaks from whichever stream (or Check Standard) the
Analyzer is currently measuring.
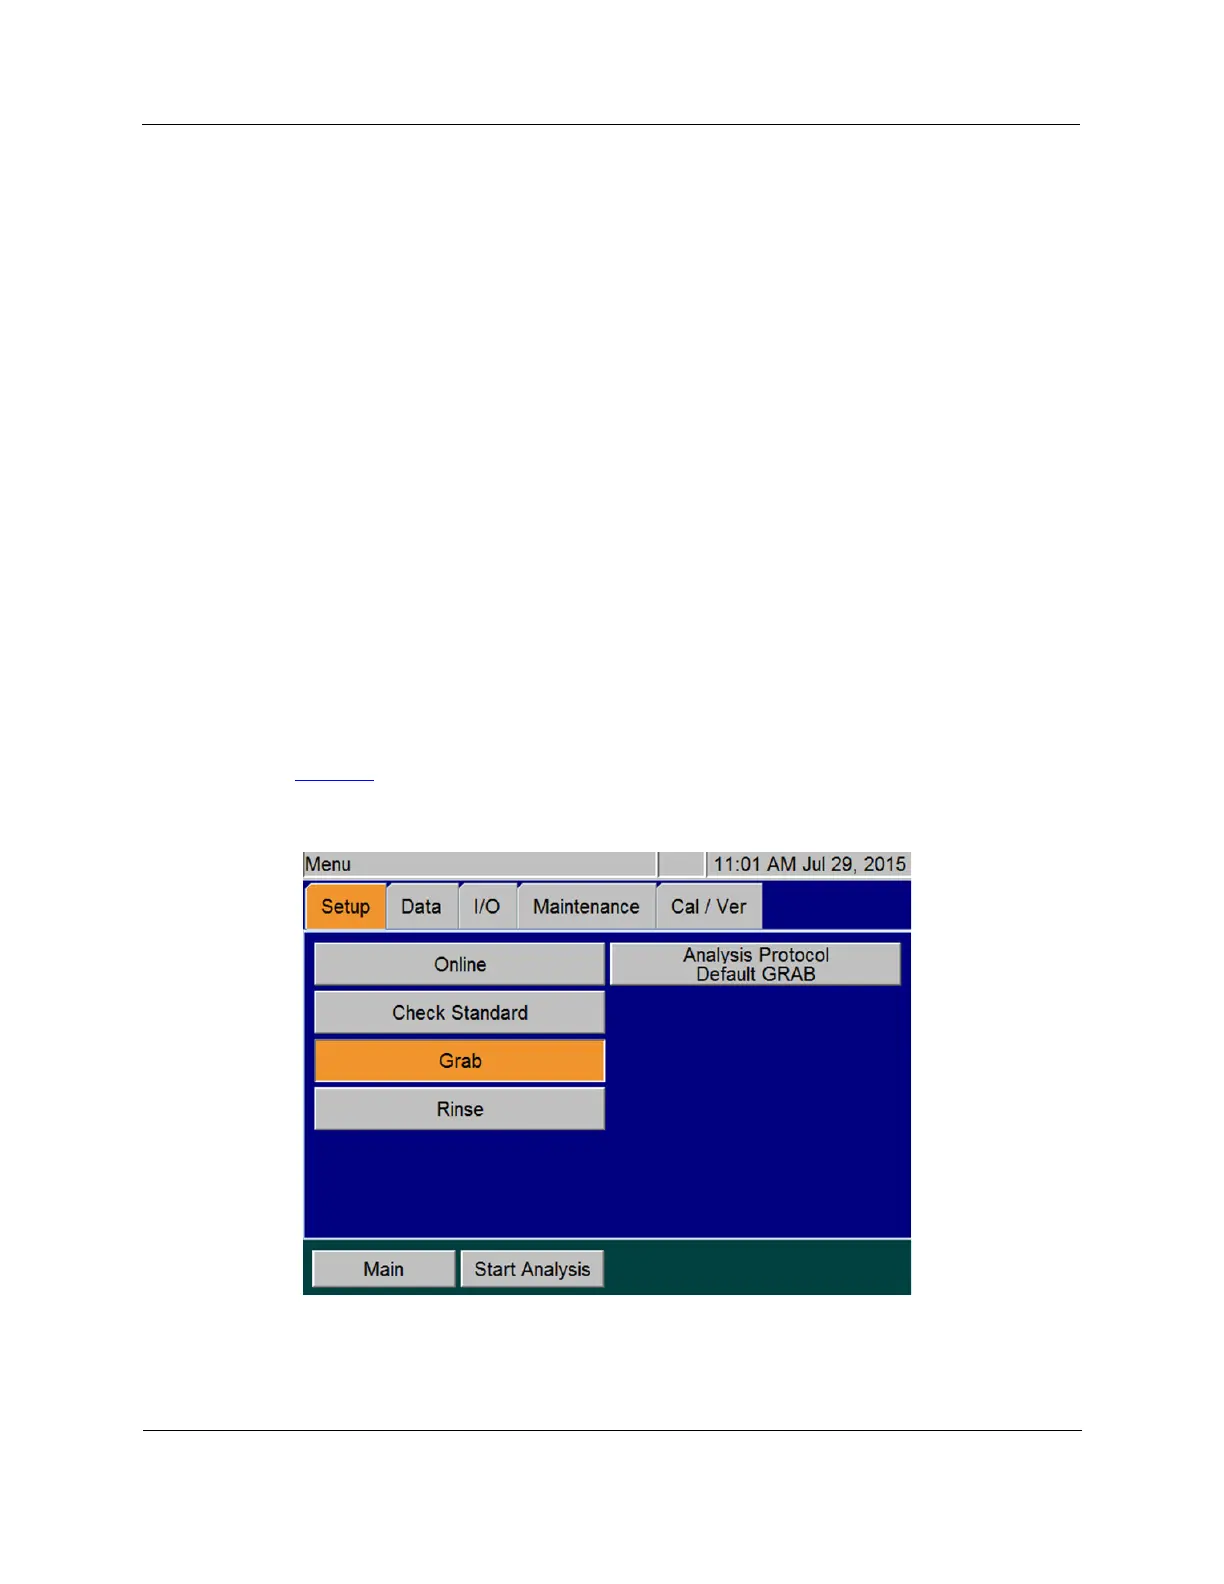
The Menu Screen
The Menu screen (Figure 40) provides you with access to all Analyzer settings and configuration options. The
Menu screen displays five tabs that provide access to the main configuration areas.
Figure 40: The Menu Screen
NOTE:
If no stream tabs (such as S1, S2, and so on) appear, this indicates that the Analyzer is set to perform one
or more manual measurements, such as a Check Standard, Grab, or Rinse measurement.
When the Analyzer is taking Grab, Check Standard, or Rinse measurements, the Main screen provides
slightly different information.

 Loading...