Achieving Perfect Exposures in Digital and Film Photography 279
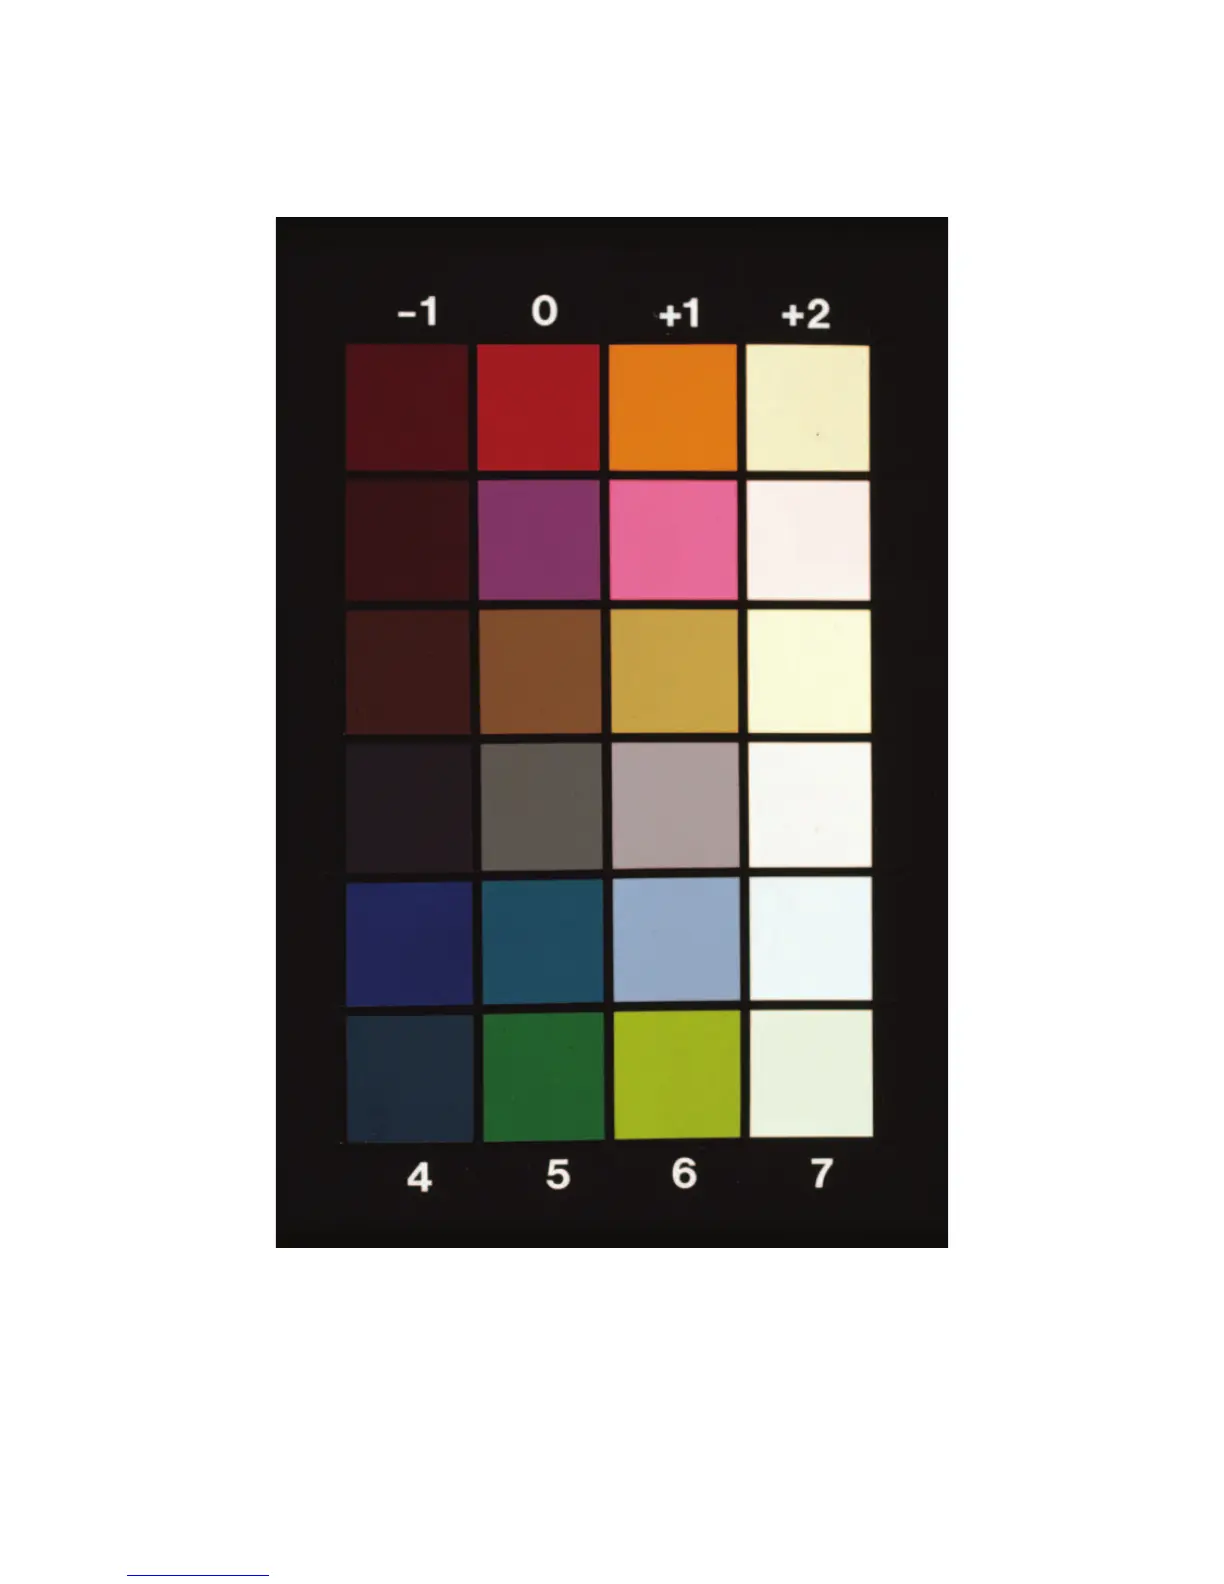
Figure 15-5 The chart shows refl ectance values of different shades of color. The color shades in
column 0 refl ect 18% of the light and therefore need no adjustments of a refl ected or built-in
meter reading. The color shades in column 1 need a 1 stop increase, those in column 2,
a 2 stop increase in a refl ected refl ected meter reading. Decrease exposure 1 stop for the
darker color shades in column 1. The fi gures 4 to 7 at the bottom indicated in which zone
the different color shades should be placed in a refl ected meter reading.