5 June 2020 CasTemp Wireless including CasTemp Superheat Page 30
5.1.3 Graph settings
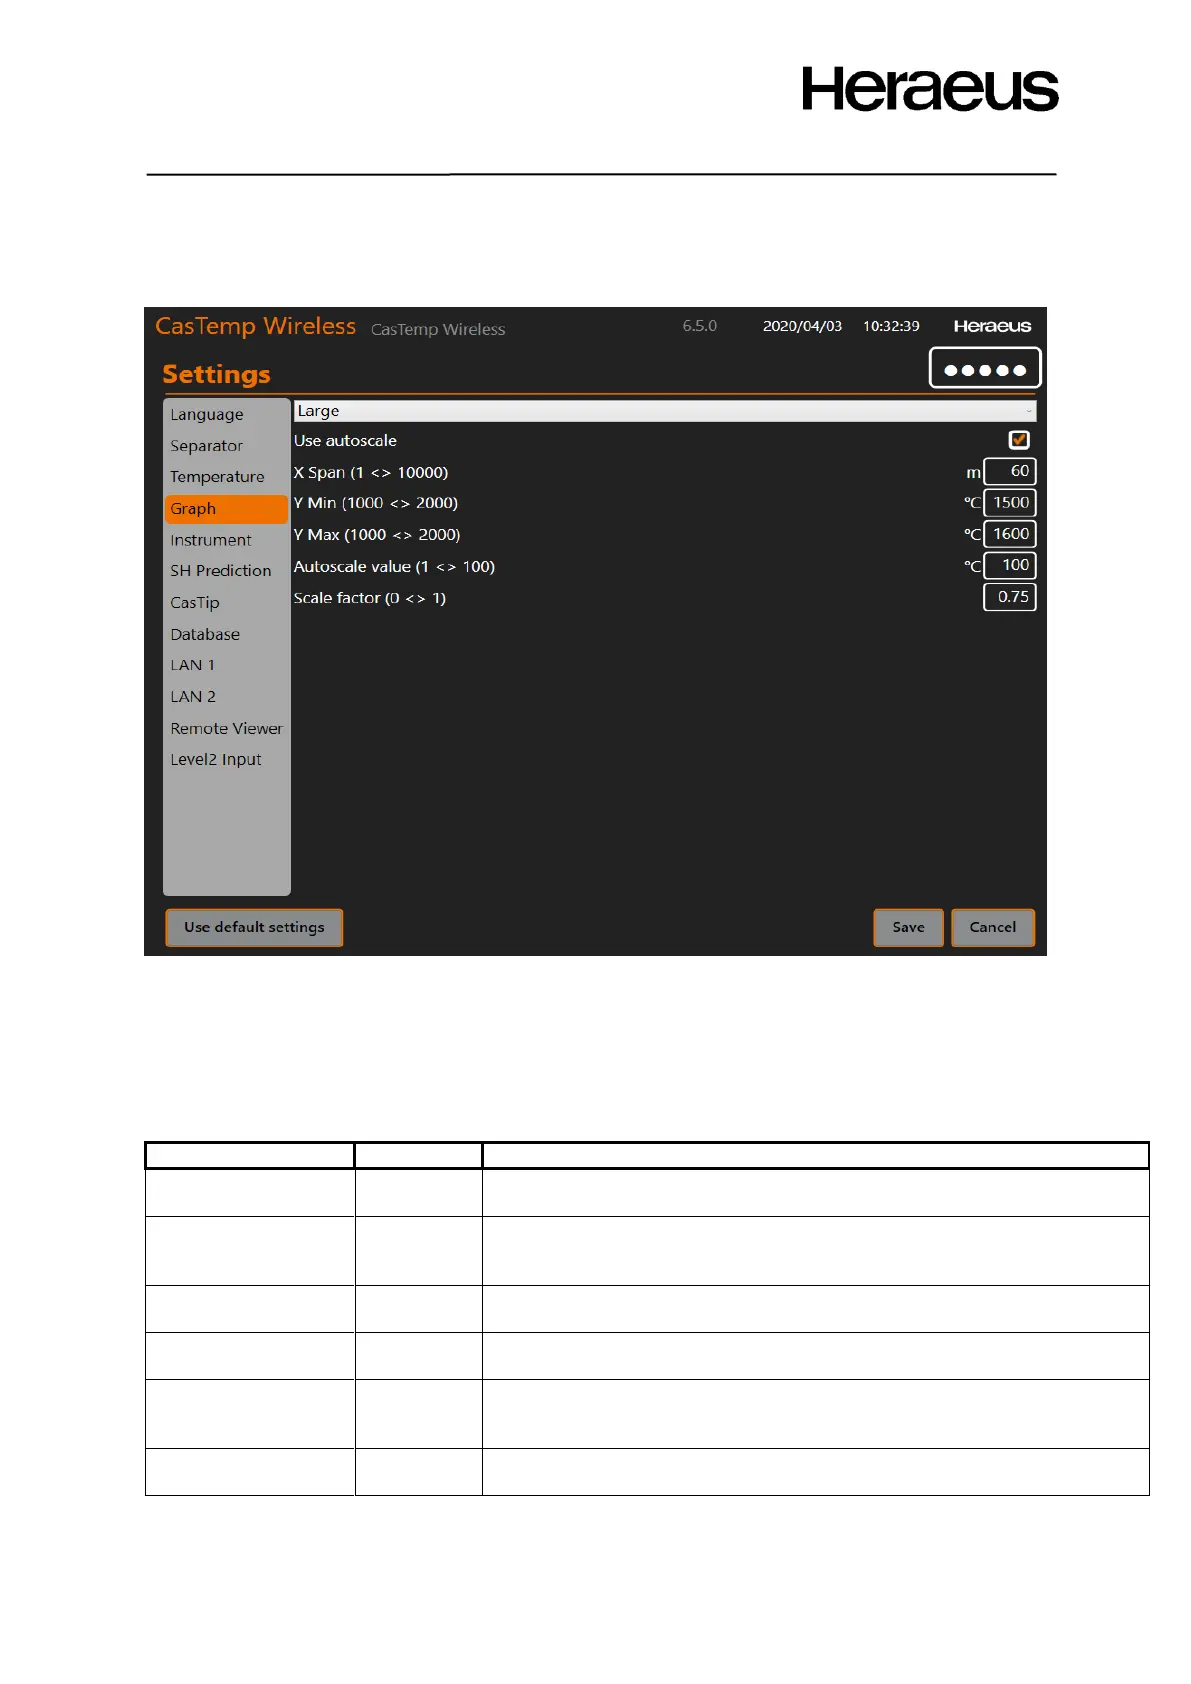
The position of the graph on the screen settings are shown in Figure 34: Changing the graph settings
Figure 34: Changing the graph settings
• Large or small graphs:
o In standard mode this positions the graph on the main screen or bottom right corner
o In superheat mode (see section 9.2.2 ) then either the superheat is displayed
(small) or the prediction screen is displayed (large)
If this option is selected, the graph autoscales its temperature axis
automatically around the last measurement point
The length of the period shown on the graph in minutes. If 60 is
selected, the graph will show the temperature history of the last 60
minutes
If the autoscale is unchecked, this is the minimum temperature that is
shown on the Y axis. The units are the selected measurement units.
If the autoscale is disabled, this is the maximum temperature that is
shown on the Y axis. The units are the selected measurement units.
If the autoscale is enabled, this is the autoscale factor. The min and max
values of the temperature axis are the last temperature + and – this
value. The units are the selected measurement units.
The current temperature position on the screen relative to the scale of
the screen.
Click Save to save the selection or Cancel to return to the previous menu.