Section III
GENERAL
OPERATING
INFORMATION
Model 3580A
frequency and, in effect,
is
the Fourier spectrum
of
the
input
signal.
Some
of
the more common measurements that
can
be
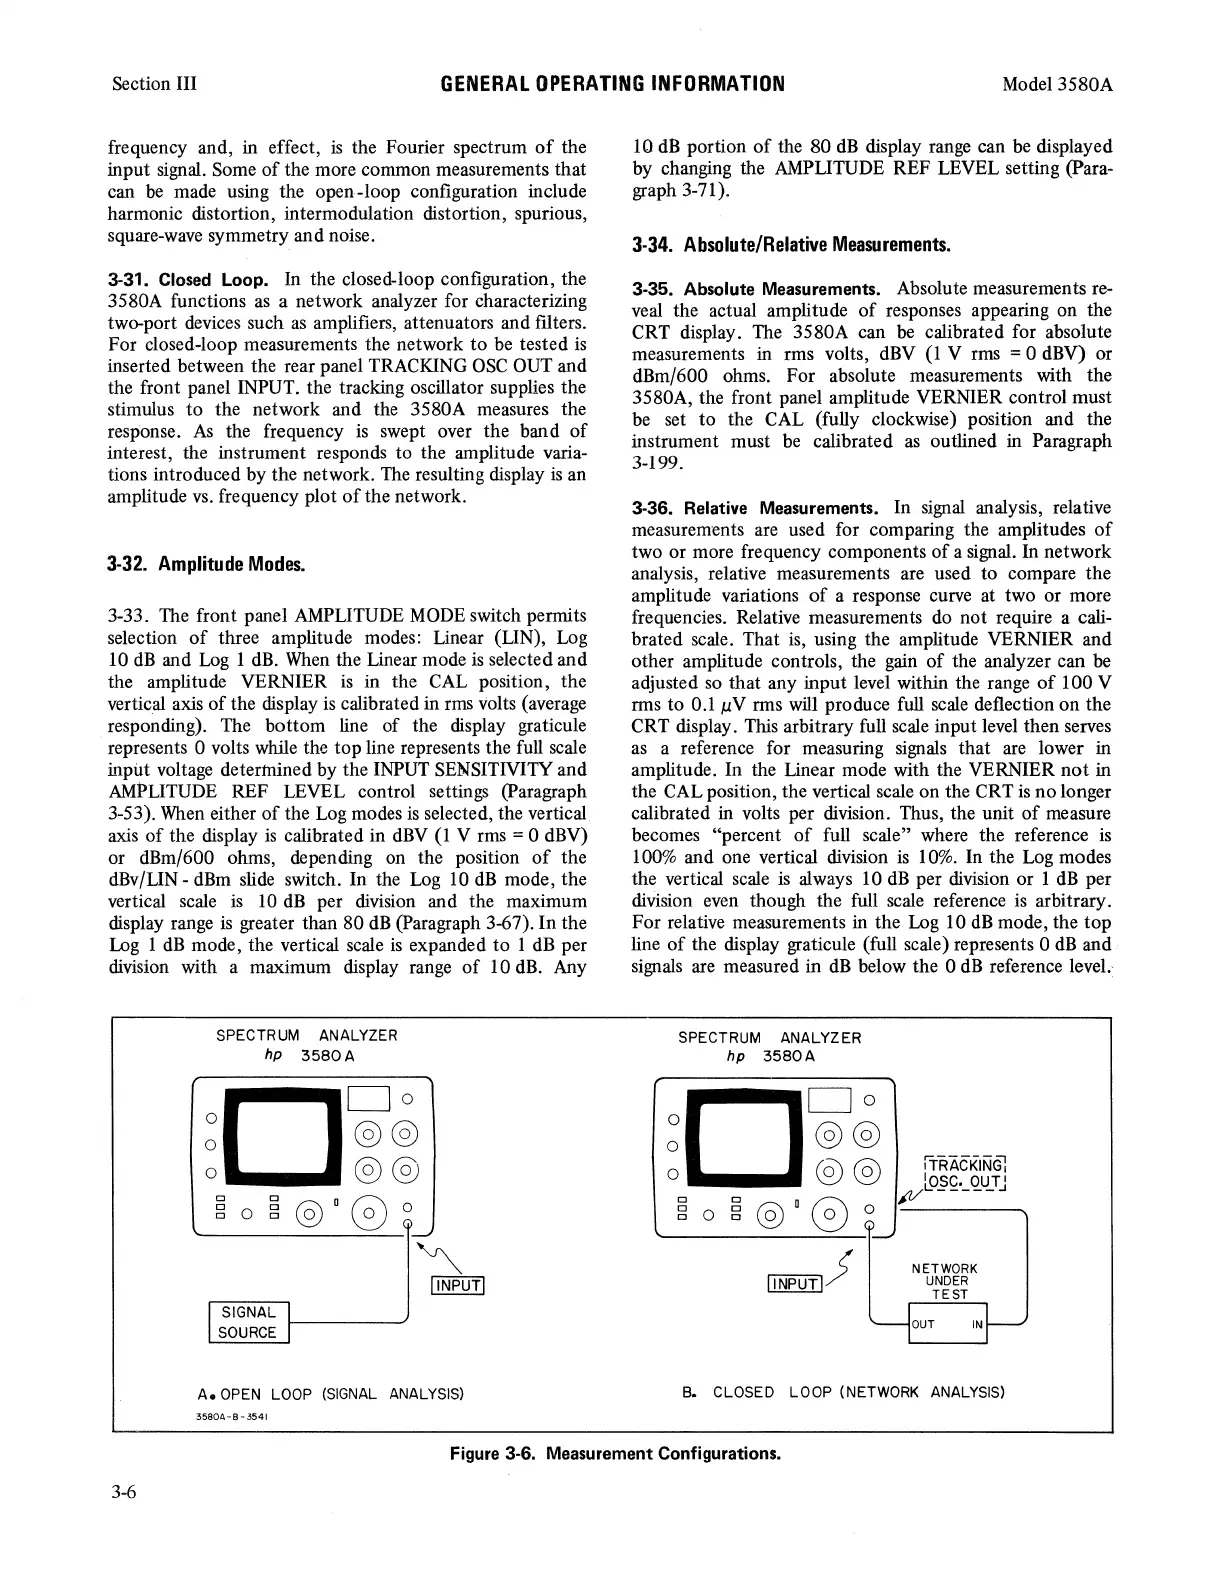
made using the open-loop configuration include
harmonic distortion, intermodulation distortion, spurious,
square-wave symmetry and noise.
3-31. Closed Loop. In the closed-loop configuration, the
3580A functions
as
a network analyzer for characterizing
two-port
devices
such
as
amplifiers, attenuators and filters.
For closed-loop measurements the network to
be
tested
is
inserted between the rear panel TRACKING
OSC
OUT
and
the front panel INPUT. the tracking oscillator supplies the
stimulus to the network and the 3580A measures the
response.
As
the frequency
is
swept over the band
of
interest, the instrument responds to the amplitude varia-
tions introduced by the network.
The
resulting display
is
an
amplitude
vs.
frequency plot
of
the network.
3-32.
Amplitude
Modes.
3-33.
The
front panel
AMPLITUDE
MODE
switch permits
selection
of
three amplitude modes: Linear (LIN),
Log
10
dB
and
Log
1
dB.
When
the Linear mode
is
selected and
the amplitude VERNIER
is
in the
CAL
position, the
vertic.al
axis
of
the display
is
calibrated in
rms
volts (average
responding). The bottom line of the display graticule
represents 0 volts while the top line represents the
full
scale
input voltage determined by the
INPUT
SENSITIVITY and
AMPLITUDE
REF LEVEL control settings (Paragraph
3-53).
When
either
of
the Log modes
is
selected, the vertical
axis
of
the display
is
calibrated in
dBV
(1
V
rms
= 0 dBV)
or dBm/600 ohms, depending
on
the position
of
the
dBv/LIN -
dBm
slide
switch. In the
Log
10
dB
mode, the
vertical
scale
is
10
dB
per division and the maximum
display range
is
greater than 80
dB
(Paragraph 3-67). In the
Log
1
dB
mode, the vertical
scale
is
expanded to 1
dB
per
division with a maximum display range
of
10
dB.
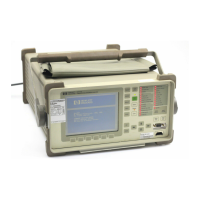
Any
SPECTRUM ANALYZER
hp
3580A
[
SIGNAL
l,___
___
_
SOURCE
I
Ae OPEN LOOP
(SIGNAL
ANALYSIS)
3580A-B-3541
10
dB
portion
of
the 80
dB
display
range
can
be
displayed
by changing the
AMPLITUDE
REF LEVEL setting (Para-
graph
3-
71
).
3-34.
Absolute/Relative
Measurements.
3-35. Absolute Measurements. Absolute measurements
re-
veal the actual amplitude
of
responses appearing on the
CRT display.
The
3580A can
be
calibrated for absolute
measurements
in
rms volts,
dBV
(I
V
rms
= 0 dBV) or
dBm/600 ohms. For absolute measurements with the
3580A, the front panel amplitude VERNIER control must
be
set to the CAL (fully clockwise) position and the
instrument must
be
calibrated
as
outlined
in
Paragraph
3-199.
3-36. Relative Measurements. In
signal
analysis, relative
measurements
are
used for comparing the amplitudes
of
two or more frequency components
of
a
signal.
In
network
analysis, relative measurements are used to compare the
amplitude variations
of
a response curve at two or more
frequencies. Relative measurements
do
not require a cali-
brated scale. That
is,
using the amplitude VERNIER and
other amplitude controls, the
gain
of
the analyzer can
be
adjusted
so
that any input
level
within the range
of
100 V
rms to
0.1
µV rms
will
produce full
scale
deflection on the
CRT display. This arbitrary full
scale
input
level
then serves
as
a reference for measuring
signals
that
are
lower in
amplitude. In the Linear mode with the VERNIER not in
the
CAL
position, the vertical scale on the CRT
is
no longer
calibrated in volts per division. Thus, the unit
of
measure
becomes "percent
of
full scale" where the reference
is
100%
and one vertical division
is
10%.
In the
Log
modes
the vertical
scale
is
always 10
dB
per division or 1
dB
per
division
even
though the full
scale
reference
is
arbitrary.
For relative measurements in the
Log
10
dB
mode, the top
line
of
the display graticule (full scale) represents 0
dB
and
signals
are
measured
in
dB
below the 0
dB
reference
level.:
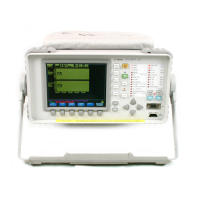
SPECTRUM ANALYZER
hp
3580A
fT"R"Aci<1i\iG]
Lose.
ouTJ
fo'
-----
NETWORK
UNDER
TEST
OUT
IN
8.
CLOSED
LOOP
(NETWORK ANALYSIS)
Figure
3-6. Measurement Configurations.
3-6