Model 3580A
GENERAL
OPERATING
INFORMATION
Section III
3-83. IF Bandpass Characteristic.
Many
signal analyzers
use
active filters that have very steep skirts and a
square-shaped bandpass characteristic that approaches the
ideal "window filter". This type
of
filtering provides a high
degree
of
selectivity, but because
of
its long transient
response time,
is
not
well
suited for swept frequency
applications. The 3580A IF Filter consists
of
5 synchron-
ously-tuned crystal filter stages. The bandpass characteris-
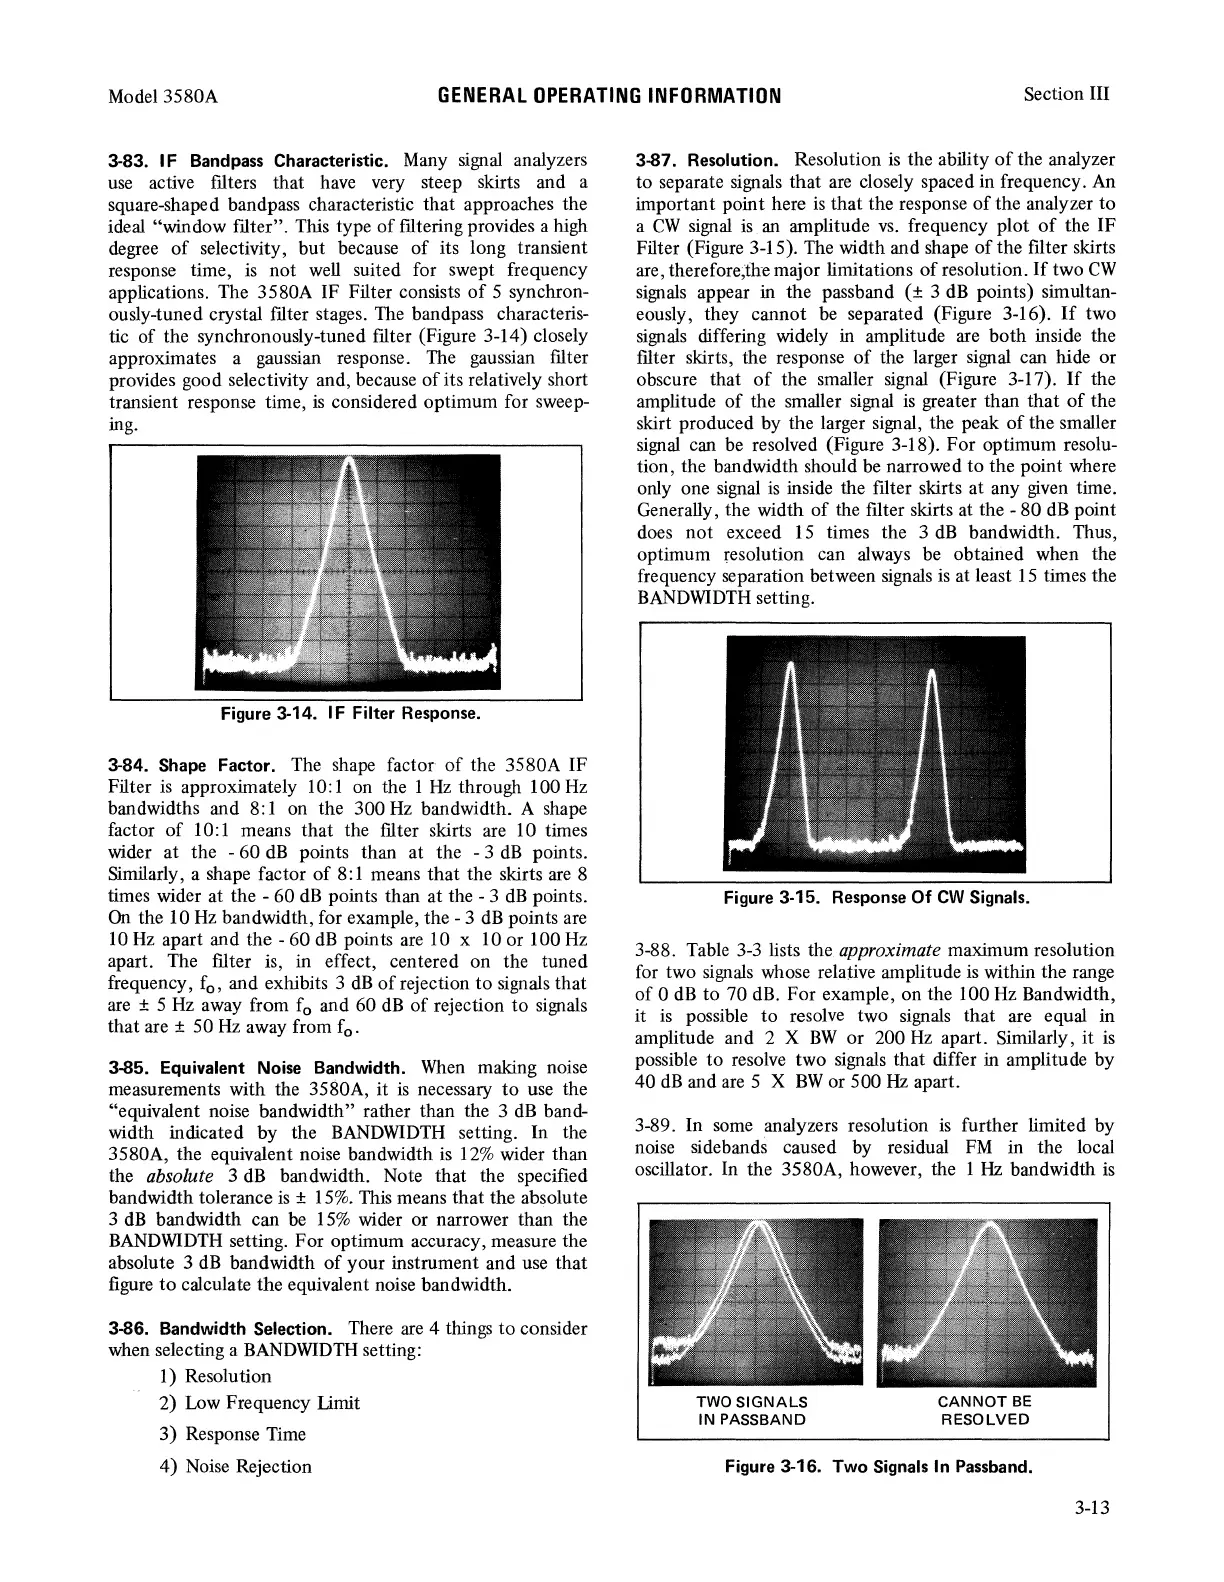
tic of the synchronously-tuned filter (Figure 3-14) closely
approximates a gaussian response. The gaussian filter
provides good selectivity and, because
of
its relatively short
transient response time,
is
considered optimum for sweep-
ing.
Figure 3-14. IF Filter Response.
3-84. Shape Factor. The shape factor
of
the 3580A
IF
Filter
is
approximately 10: 1 on the 1
Hz
through 100
Hz
bandwidths and
8:
1 on the 300
Hz
bandwidth. A shape
factor
of
10: 1 means that the filter skirts
are
10 times
wider
at
the - 60
dB
points than at the - 3
dB
points.
Similarly, a shape factor
of
8: 1 means that the skirts
are
8
times wider at the - 60
dB
points than at the - 3
dB
points.
On
the 10
Hz
bandwidth, for example, the - 3
dB
points
are
10
Hz
apart and the - 60
dB
points
are
10 x 10 or 100
Hz
apart. The filter is, in effect, centered on the tuned
frequency, f
0
, and exhibits 3
dB
of
rejection
to
signals that
are
± 5
Hz
away from f
0
and 60
dB
of
rejection
to
signals
that are ± 50
Hz
away from f
0
•
3-85. Equivalent Noise Bandwidth.
When
making noise
measurements with the 3580A, it is necessary
to
use the
"equivalent noise bandwidth" rather than the 3
dB
band-
width indicated by the
BANDWIDTH
setting.
In
the
3580A, the equivalent noise bandwidth
is
12%
wider than
the absolute 3
dB
bandwidth. Note that the specified
bandwidth tolerance
is
±
15%.
This means that the absolute
3
dB
bandwidth can
be
15%
wider or narrower than the
BANDWIDTH
setting. For optimum accuracy, measure the
absolute 3
dB
bandwidth
of
your instrument and use that
figure
to
calculate the equivalent noise bandwidth.
3-86. Bandwidth Selection. There
are
4 things
to
consider
when selecting a
BANDWIDTH
setting:
1) Resolution
2) Low Frequency
limit
3)
Response Time
4)
Noise
Rejection
3-87. Resolution. Resolution
is
the ability
of
the analyzer
to separate signals that
are
closely spaced in frequency. An
important point here
is
that the response
of
the analyzer to
a
CW
signal
is
an
amplitude
vs.
frequency plot
of
the IF
Filter (Figure 3-15). The width and shape
of
the filter skirts
are, therefore;the major limitations
of
resolution.
If
two
CW
signals
appear in the passband (± 3
dB
points) simultan-
eously, they cannot
be
separated (Figure 3-16).
If
two
signals
differing widely in amplitude are both inside the
filter skirts, the response
of
the larger signal can hide or
obscure that
of
the smaller signal (Figure 3-17).
If
the
amplitude
of
the smaller signal
is
greater than that
of
the
skirt produced by the larger signal, the peak
of
the smaller
signal
can
be
resolved (Figure 3-18). For optimum resolu-
tion, the bandwidth should
be
narrowed
to
the point where
only one
signal
is
inside the filter skirts at any
given
time.
Generally, the width
of
the filter skirts at the - 80
dB
point
does not exceed
15
times the 3
dB
bandwidth. Thus,
optimum resolution can always be obtained when the
frequency separation between signals
is
at least
15
times the
BANDWIDTH
setting.
Figure 3-15. Response Of
CW
Signals.
3-88. Table
3-3
lists the approximate maximum resolution
for two
signals
whose relative amplitude
is
within the range
of
0
dB
to
70
dB.
For example, on the 100
Hz
Bandwidth,
it
is
possible
to
resolve two signals that are equal in
amplitude and 2 X
BW
or 200
Hz
apart. Similarly, it
is
possible
to
resolve two signals that differ in amplitude by
40
dB
and
are
5 X
BW
or 500
Hz
apart.
3-89. In some analyzers resolution
is
further limited by
noise sidebands caused by residual
FM
in the local
oscillator. In the 3580A, however, the 1
Hz
bandwidth
is
TWO
SIGNALS
IN PASSBAND
CANNOT
BE
RESOLVED
Figure 3-16. Two Signals
In
Passband.
3-13