Section III
GENERAL
OPERATING
INFORMATION
Model3580A
3-74. The Amplitude Accuracy specification
is
broken
down
so
that portions
of
the specification that
do
not
apply to a particular measurement can be eliminated.
All
applicable portions
of
the specification must be added
together
to
obtain the overall accuracy specification.
It
should be noted that the overall accuracy specification
reflects the absolute
worst-case
error that could possibly be
encountered. Typically,
all
parameters
are
well
within their
specified tolerances and the probability
of
having a worst-
case
condition
is
very slight.
As
more parameters are added
to the specification, the magnitude
of
the possible worst-
case
error increases but the probability
of
having a
worst-case condition greatly decreases.
3-75.
The
Frequency Response, Amplitude Display and
Input Attenuator specifications must always
be
taken into
account when calculating the overall accuracy specification.
Excluding the Switching Between Bandwidths and Ampli-
tude Ref.
Level
specifications, the worst
case
error
is
± 2.8
dB
in the
Log
mode or ±
10%
of
reading in the
Linear mode.
3-76. The Switching Between Bandwidths specification can
be disregarded
as
long
as
the Amplitude Calibration
Procedure
is
performed on the
BANDWIDTH
setting that
is
used for measurements.
If
the
BANDWIDTH
setting
is
changed, the Switching Between Bandwidths specification
must
be
added to the overall accuracy specification.
Similarly, the Amplitude Ref.
Level
specification can
be
disregarded
as
long
as
the
AMPLITUDE
REF LEVEL
control
is
in the
NORMAL
position.
If
the
AMPLITUDE
REF LEVEL setting
is
changed, the Amplitude Ref.
Level
specification must also
be
added to the overall accuracy
specification.
3-77.
Internal
Cal.
Signal.
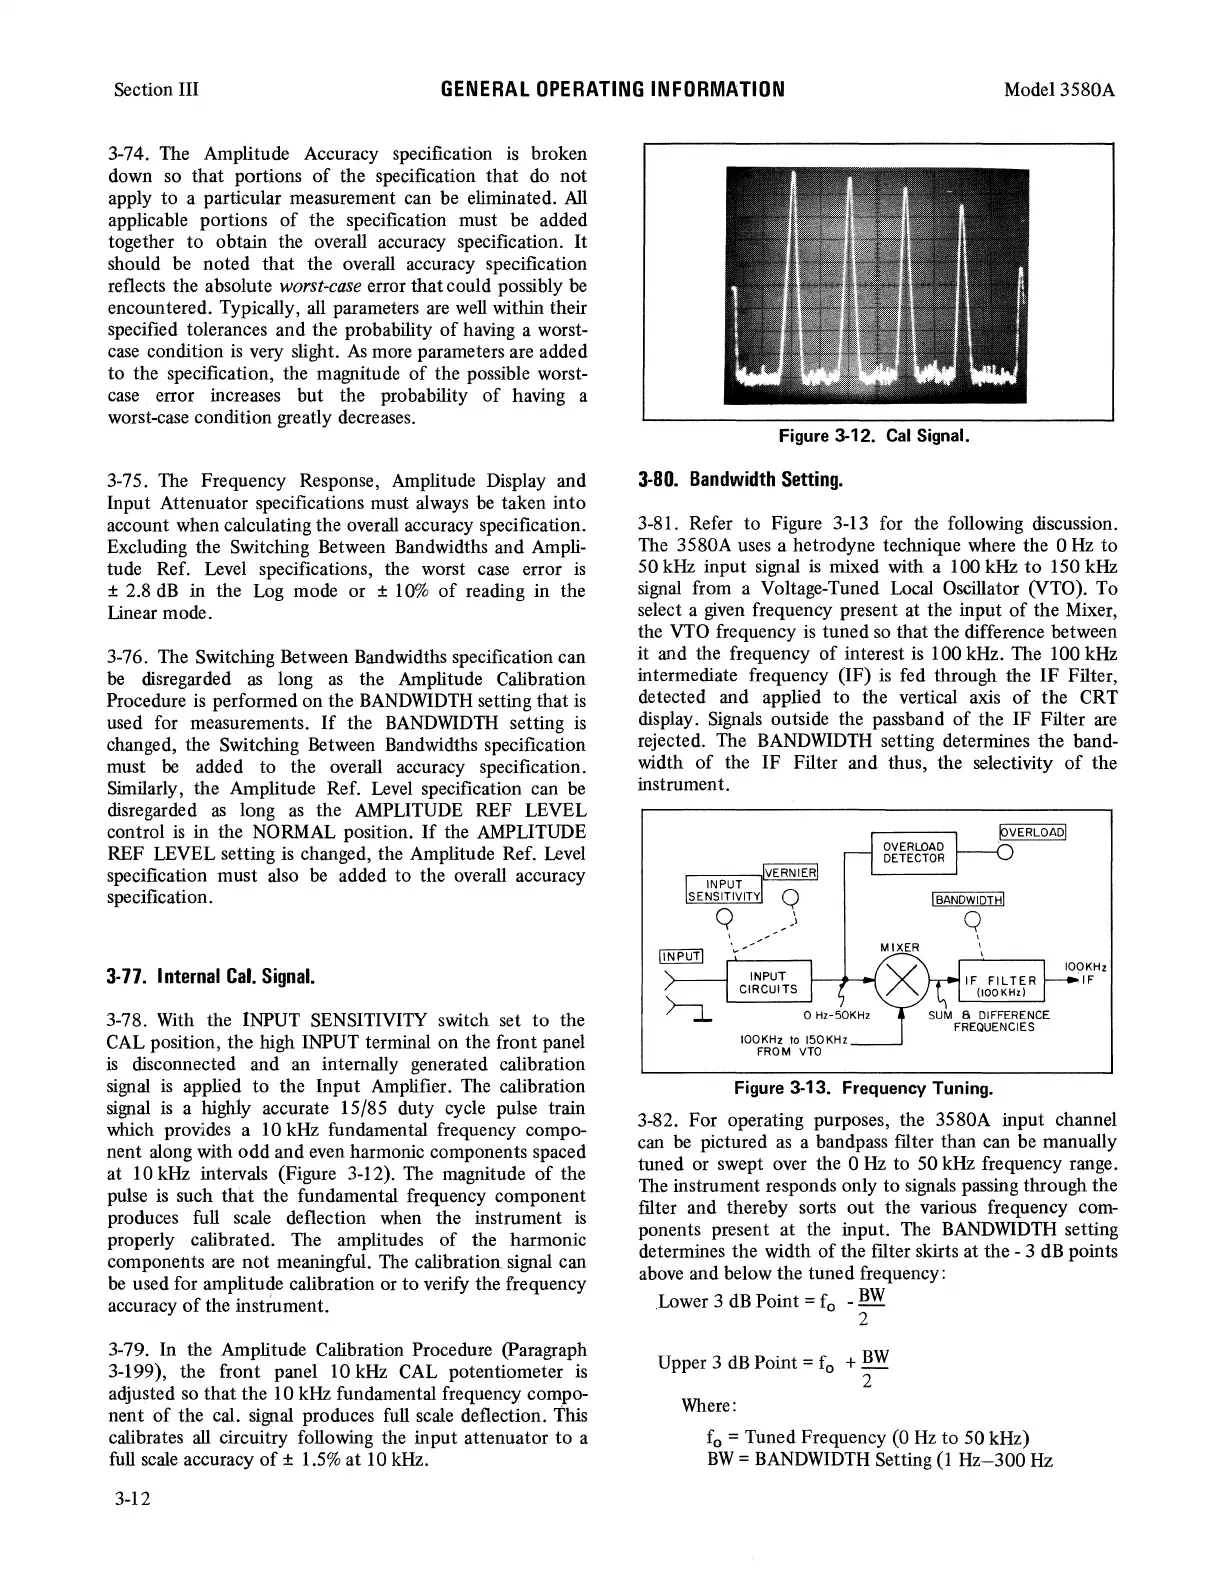
3-78.
With
the INPUT SENSITIVITY switch set
to
the
CAL
position, the high INPUT terminal on the front panel
is
disconnected and
an
internally generated calibration
signal
is
applied to the Input Amplifier.
The
calibration
signal
is
a highly accurate 15/85 duty cycle pulse train
which provides a 10 kHz fundamental frequency compo-
nent along with odd and
even
harmonic components spaced
at 10 kHz intervals (Figure 3-12).
The
magnitude
of
the
pulse
is
such that the fundamental frequency component
produces
full
scale deflection
when
the instrument
is
properly calibrated. The amplitudes
of
the harmonic
components
are
not meaningful.
The
calibration signal can
be used for amplitude calibration
or
to verify the frequency
accuracy
of
the instrument.
3-79. In the Amplitude Calibration Procedure (Paragraph
3-199), the front panel 10
kHz
CAL
potentiometer
is
adjusted so that the 10 kHz fundamental frequency compo-
nen t
of
the cal.
signal
produces
full
scale
deflection.
this
calibrates
all
circuitry following the input attenuator to a
full
scale
accuracy
of
±
1.5%
at
10 kHz.
3-12
Figure 3-12.
Cal
Signal.
3-80.
Bandwidth
Setting.
3-81. Refer to Figure 3-13 for the following discussion.
The
3580A uses a hetrodyne technique where the 0
Hz
to
50
kHz
input signal
is
mixed with a 100 kHz
to
150 kHz
signal
from a Voltage-Tuned
Local
Oscillator (VTO). To
select a
given
frequency present at the input
of
the Mixer,
the
VTO
frequency is tuned
so
that the difference between
it and the frequency
of
interest
is
100 kHz. The 100 kHz
intermediate frequency (IF)
is
fed through the IF Filter,
detected and applied to the vertical axis
of
the CRT
display.
Signals
outside the passband
of
the IF Filter
are
rejected. The
BANDWIDTH
setting determines the band-
width
of
the IF Filter and thus, the selectivity
of
the
instrument.
---1IVERNIERI
INPUT
SENSITIVITY Q
Q
__
\
I ,
.
--
ilNPUTl
,....v_·--~
OVERLOAD
DETECTOR
I
BANDWIDTH!
Q
I
I
I
IOOKHz
INPUT
CIRCUITS
IF
FILTER
.IF
JOOKHz
to
150KHz
FROM
VTO
(IOOKHz)
Figure 3-13. Frequency Tuning.
3-82. For operating purposes, the 3580A input channel
can
be
pictured
as
a bandpass filter than can be manually
tuned or swept over the 0 Hz to 50 kHz frequency range.
The
instrument responds only to
signals
passing through the
filter and thereby sorts out the various frequency com-
ponents present at the input.
The
BANDWIDTH
setting
determines the width
of
the filter skirts at the - 3
dB
points
above
and below the tuned frequency:
.Lower
3
dB
Point = f
0
-
BW
2
Upper 3
dB
Point = f
0
+
BW
2
Where:
f
0
= Tuned Frequency (0
Hz
to 50 kHz)
BW
=
BANDWIDTH
Setting
(1
Hz-300
Hz