Model 3580A
GENERAL
OPERATING
INFORMATION
Section III
V2
A=vi
XlOO
Where:
A = relative amplitude in percent
Vl = reference level in rms volts
V2
= signal level in rms volts
3-66.
Amplitude
Measurements
(Log
Mode).
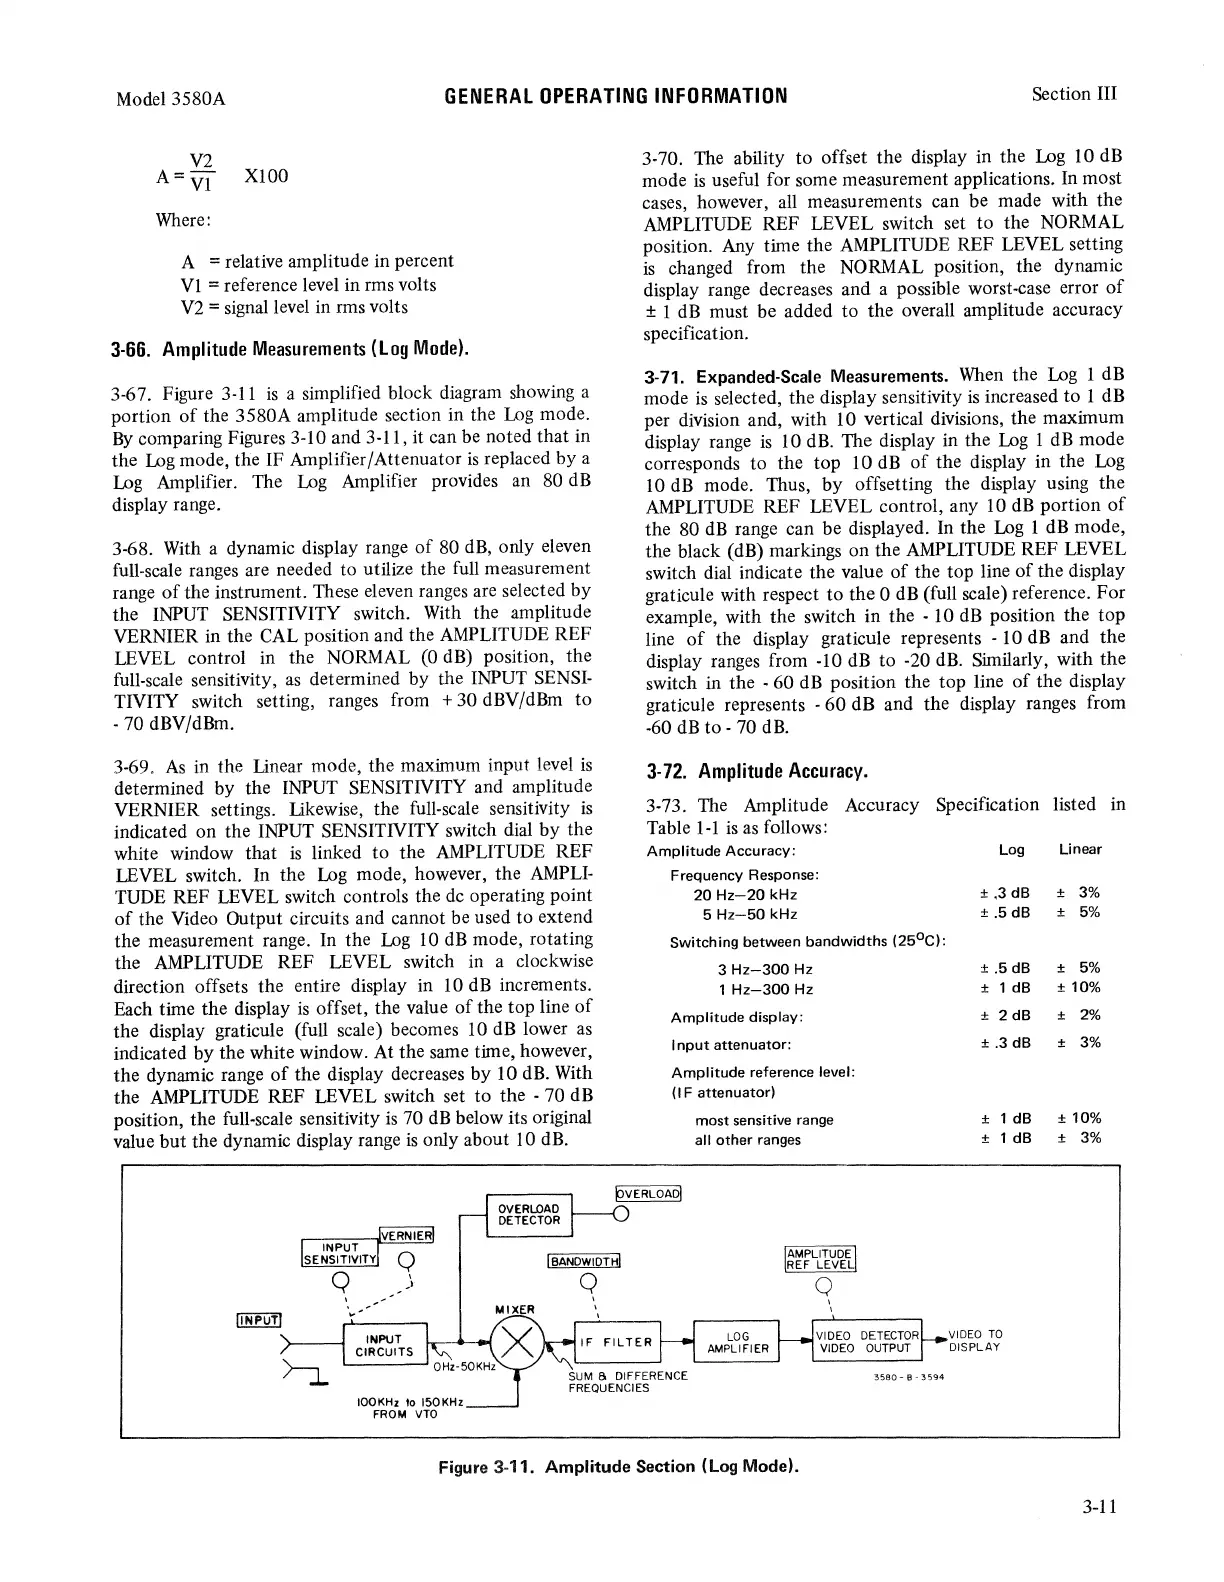
3-67. Figure
3-11
is
a simplified block diagram showing a
portion
of
the 3580A amplitude section in the
Log
mode.
By
comparing Figures 3-10 and 3-11, it can be noted that in
the
Log
mode, the IF Amplifier/ Attenuator
is
replaced by a
Log
Amplifier. The
Log
Amplifier provides an 80
dB
display range.
3-68. With a dynamic display range
of
80
dB,
only eleven
full-scale ranges are needed to utilize the
full
measurement
range
of
the instrument. These eleven ranges are selected by
the INPUT SENSITNITY switch. With the amplitude
VERNIER
in
the CAL position and the AMPLITUDE REF
LEVEL control in the NORMAL (0 dB) position, the
full-scale sensitivity,
as
determined by the INPUT
SENSI-
TIVITY switch setting, ranges from + 30 dBV/dBm to
- 70 dBV/dBm.
3-69.
As
in the Linear mode, the maximum input level
is
determined by the INPUT SENSITNITY and amplitude
VERNIER settings. Likewise, the full-scale sensitivity
is
indicated on the INPUT SENSITNITY switch dial by the
white window that
is
linked
to
the AMPLITUDE REF
LEVEL switch. In the
Log
mode, however, the
AMPLI-
TUDE REF LEVEL switch controls the
de
operating point
of
the Video Output circuits and cannot be used to extend
the measurement range. In the
Log
10
dB
mode, rotating
the AMPLITUDE REF LEVEL switch in a clockwise
direction offsets the entire display in 10
dB
increments.
Each time the display
is
offset, the value
of
the top line
of
the display graticule (full scale) becomes 10
dB
lower
as
indicated by the white window. At the same time, however,
the dynamic range
of
the display decreases by 10
dB.
With
the AMPLITUDE REF LEVEL switch set
to
the - 70 dB
position, the full-scale sensitivity
is
70
dB
below its original
value but the dynamic display range
is
only about 10
dB.
OVERLOAD
DETECTOR
J BANDWIDTH(
Q
'
'
3-
70. The ability to offset the display in the
Log
10
dB
mode
is
useful for some measurement applications. In most
cases, however, all measurements can be made with the
AMPLITUDE REF LEVEL switch set
to
the NORMAL
position.
Any
time the AMPLITUDE REF LEVEL setting
is
changed from the NORMAL position, the dynamic
display range decreases and a possible worst-case error
of
± 1
dB
must be added to the overall amplitude accuracy
specification.
3-71. Expanded-Scale Measurements.
When
the
Log
1
dB
mode
is
selected, the display sensitivity
is
increased to 1 dB
per division and, with 10 vertical divisions, the maximum
display range
is
10
dB.
The display in the
Log
1
dB
mode
corresponds to the top 10
dB
of
the display in the
Log
10 dB mode. Thus, by offsetting the display using the
AMPLITUDE
REF LEVEL control, any 10
dB
portion
of
the 80
dB
range can be displayed. In the
Log
1
dB
mode,
the black (dB) markings on the AMPLITUDE REF LEVEL
switch
dial
indicate the value
of
the top line
of
the display
graticule with respect
to
the 0
dB
(full scale) reference. For
example, with the switch in the · 10
dB
position the top
line
of
the display graticule represents • 10
dB
and the
display ranges from -10 dB
to
-20
dB.
Similarly, with the
switch in the • 60
dB
position the top line
of
the display
graticule represents · 60 dB and the display ranges from
-60
dB
to·
70
dB.
3-72.
Amplitude
Accuracy.
3-73. The Amplitude Accuracy Specification listed in
Table
1-1
is
as
follows:
Amplitude
Accuracy:
Frequency
Response:
20
Hz-20
kHz
5
Hz-50
kHz
Switching
between
bandwidths
(25°C):
3
Hz-300
Hz
1
Hz-300
Hz
Amplitude
display:
Input
attenuator:
Amplitude
reference level:
(IF
attenuator)
most
sensitive range
all
other
ranges
AMPLITUDE
REF
LEVEL
0
'
'
Log
Linear
± .3 dB ± 3%
± .5 dB ± 5%
±
.5
dB ± 5%
± 1 dB ±
10%
± 2 dB ± 2%
± .3 dB ±
3%
± 1 dB ±
10%
± 1 dB ± 3%
INPUT
CIRCUITS
IF
FILTER
LOG
VIDEO
DETECTOR
VIDEO
TO
AMPLIFIER
VIDEO
OUTPUT
DISPLAY
IOOKHz
lo
150KHz
FROM
VTO
SUM
a DIFFERENCE
FREQUENCIES
Figure 3-11. Amplitude Section (Log Mode).
3580-
B -
3594
3-11