Section III
GENERAL
OPERATING
INFORMATION
Model 3580A
3-41.
Sensitivity.
3-42. Sensitivity is a figure
of
merit that defines the
analyzer's ability
to
detect or respond
to
a given input level.
There are three types
of
sensitivity that are
of
interest when
operating the 3580A:
a. Maximum Sensitivity
b. Full Scale Sensitivity
c. Display Sensitivity
3-43. Maximum Sl!nsitivity. Maximum Sensitivity refers
to
the smallest signal
that
can be detected
by
the analyzer.
The maximum sensitivity
of
the analyzer
is
limited by its
own internally generated noise and
is
commonly defined
as
the point where the signal level
is
equal
to
the noise level.
This
is
sometimes called "tangential sensitivity".
3-44. Nyquist's Noise Equation
1
reveals two important
things about noise
that
apply
to
the 3580A:
a. Noise
is
proportional
to
the
square
root
of
band·
width. . . Noise level decreases and sensitivity increases
as
the BANDWIDTH setting
is
narrowed.
b. Noise
is
proportional
to
the
square
root
of
input
resistance... The 3580A has a high
(l
Megohm) input
resistance. This means
that
noise
is
largely dependent on
the source resistance placed at the INPUT terminals. Signal
sources having low
output
resistances will produce a lower
noise level than those having high output resistances.
3-45. Noise level
is
also dependent on the tuned frequency
of
the instrument. Semiconductors in the input stages
of
the instrument exhibit surface noise which has a 1
/f
frequency spectrum. This surface noise is predominate at
frequencies below 1 kHz. When the 3580A
is
tuned
below
1 kHz, the noise level increases and sensitivity decreases.
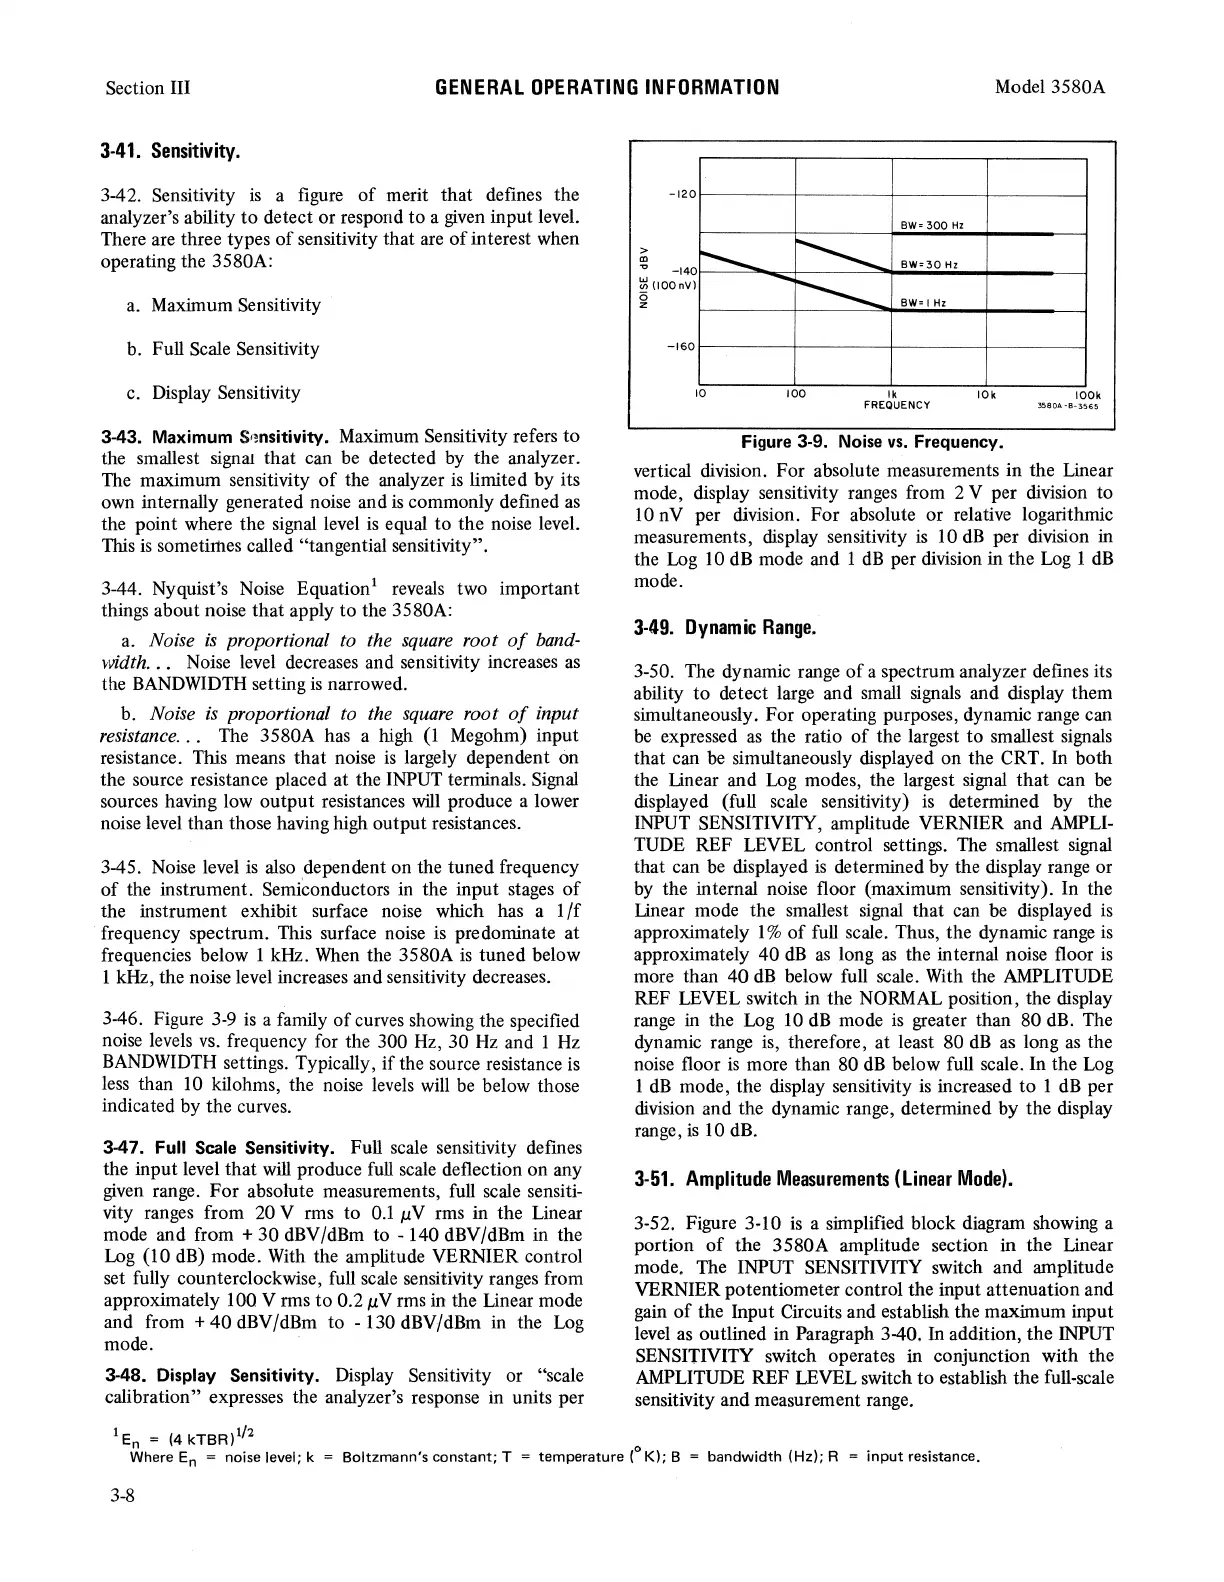
3-46. Figure 3-9
is
a family
of
curves showing the specified
noise levels
vs.
frequency for the 300 Hz, 30 Hz and 1 Hz
BANDWIDTH settings. Typically,
if
the source resistance
is
less than 10 kilohms, the noise levels will be below those
indicated by the curves.
3-47. Full Scale Sensitivity. Full scale sensitivity defines
the input level
that
will produce full scale deflection on any
given range.
For
absolute measurements, full scale sensiti-
vity ranges from 20 V rms
to
0.1
µV rms in the Linear
mode and from +
30
dBV/dBm
to
-140
dBV/dBm in the
Log (10 dB) mode. With the amplitude VERNIER control
set fully counterclockwise, full scale sensitivity ranges from
approximately 100 V rms
to
0.2
µVrms
in the Linear mode
and from +
40
dBV/dBm
to
- 130 dBV/dBm in the Log
mode.
3-48. Display Sensitivity. Display Sensitivity or "scale
calibration" expresses the analyzer's response in units per
-120r-----t------+----t-------l
BW•
300
Hz
-160r-----r-------+----t-------I
10
100
lk
FREQUENCY
I
Ok
Figure 3-9. Noise
vs.
Frequency.
IOOk
35SOA~B~3565
vertical division.
For
absolute measurements
in
the Linear
mode, display sensitivity ranges from 2 V per division
to
10 nV per division.
For
absolute or relative logarithmic
measurements, display sensitivity
is
10
dB
per division in
the Log 10 dB mode and 1
dB
per division in
the
Log 1
dB
mode.
3-49.
Dynamic
Range.
3-50. The dynamic range
of
a spectrum analyzer defines its
ability
to
detect large and small signals and display them
simultaneously. For operating purposes, dynamic range can
be
expressed
as
the ratio
of
the largest
to
smallest signals
that can be simultaneously displayed on the CRT. In both
the
linear
and Log modes, the largest signal
that
can be
displayed (full scale sensitivity)
is
determined by the
INPUT SENSITIVITY, amplitude VERNIER and AMPLI-
TUDE REF LEVEL control settings. The smallest signal
that can be displayed
is
determined by the display range or
by the internal noise floor (maximum sensitivity). In the
Linear mode the smallest signal that can be displayed is
approximately 1 %
of
full scale. Thus, the dynamic range
is
approximately
40
dB
as
long
as
the internal noise floor
is
more than
40
dB
below full scale. With the AMPLITUDE
REF LEVEL switch in the NORMAL position, the display
range in the Log 10
dB
mode
is
greater than 80 dB. The
dynamic range is, therefore, at least 80
dB
as
long
as
the
noise floor
is
more than 80
dB
below full scale. In the Log
1
dB
mode, the display sensitivity
is
increased
to
1
dB
per
division and the dynamic range, determined
by
the display
range,
is
10 dB.
3-51.
Amplitude
Measurements
(Linear
Mode).
3-52. Figure 3-10
is
a simplified block diagram showing a
portion
of
the
3580A amplitude section
in
the
Linear
mode. The INPUT SENSITIVITY switch and amplitude
VERNIER potentiometer control the input attenuation and
gain
of
the Input Circuits and establish the maximum input
level as outlined in Paragraph 3-40. In addition,
the
INPUT
SENSITNITY switch operates in conjunction with the
AMPLITUDE REF LEVEL switch
to
establish
the
full-scale
sensitivity and measurement range.
1
En
=
(4
kTBR)
1
/
2
.
Where
En
= noise level; k = Boltzmann's constant; T = temperature (°
K);
B =
bandwidth
(Hz); R =
input
resistance.
3-8