Section III
GENERAL
OPERATING
INFORMATION
Model 3580A
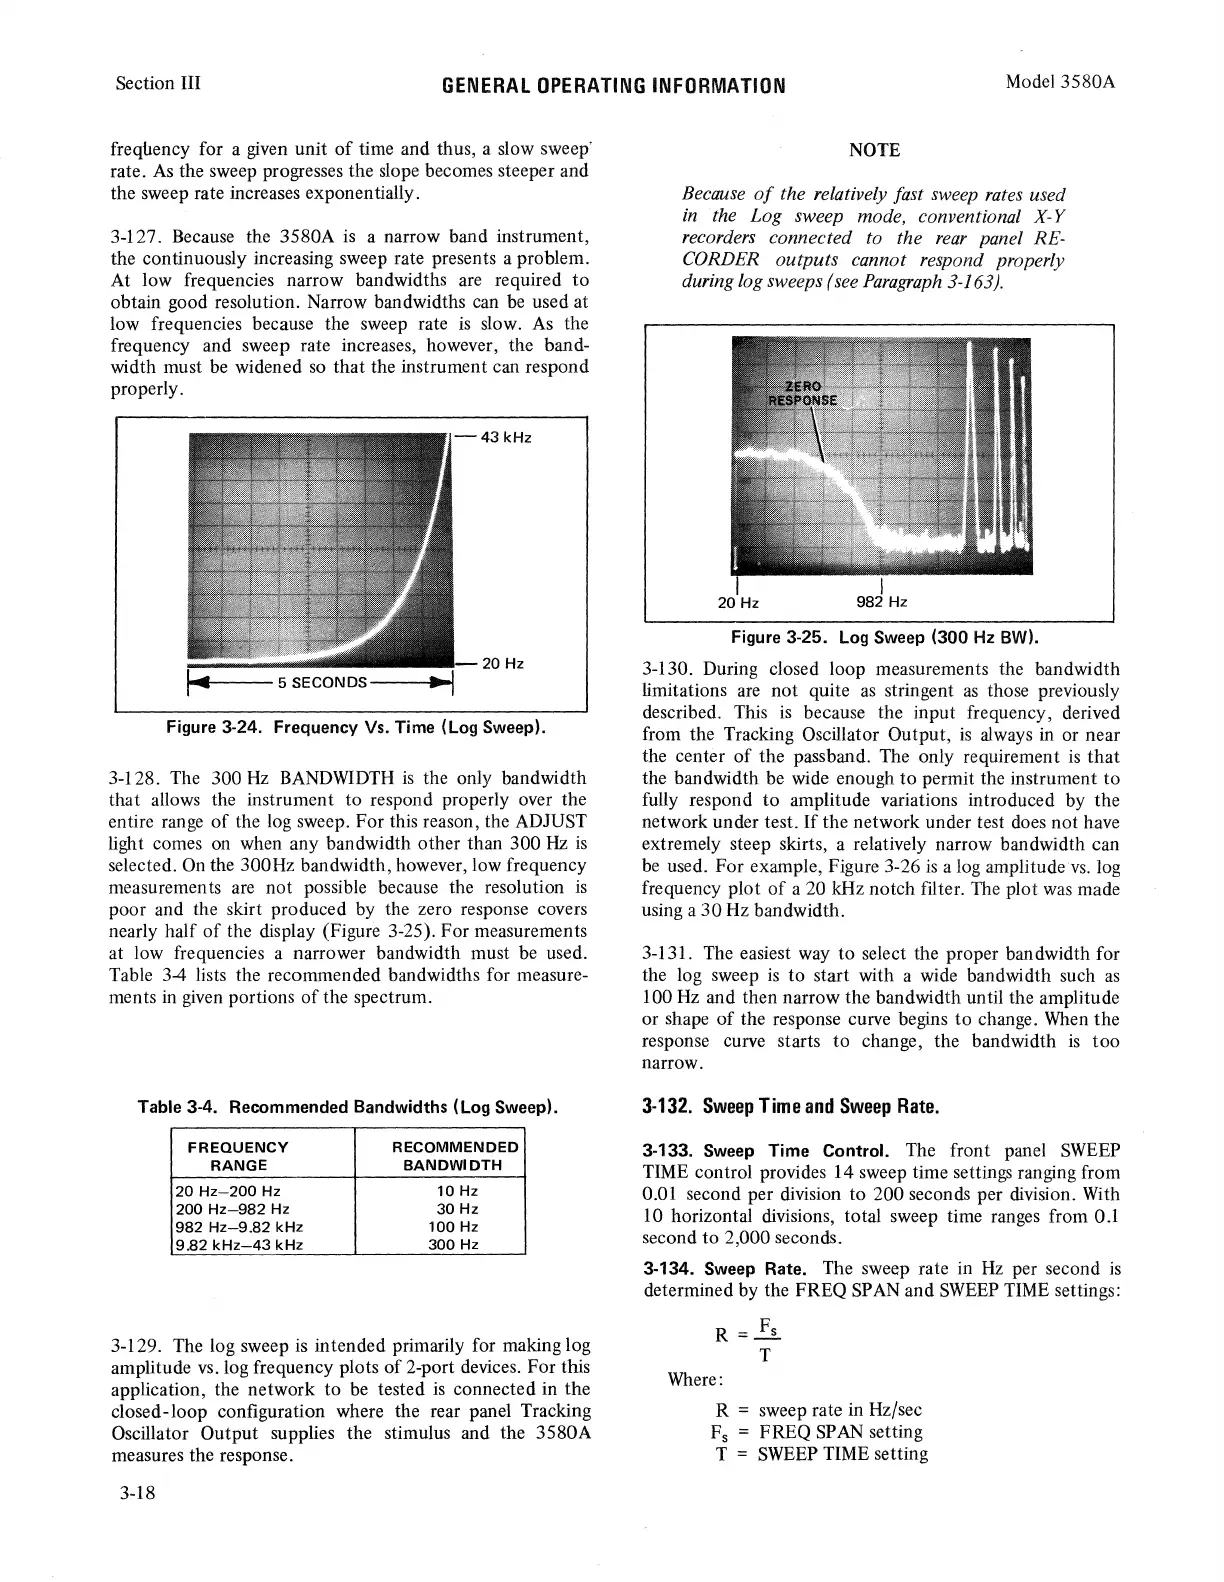
freqllency for a given unit
of
time and thus, a slow sweep'
rate.
As
the sweep progresses the slope becomes steeper and
the sweep rate increases exponentially.
3-127. Because the 3580A
is
a narrow band instrument,
the continuously increasing sweep rate presents a problem.
At low frequencies narrow bandwidths are required
to
obtain good resolution. Narrow bandwidths can
be
used at
low frequencies because the sweep rate
is
slow.
As
the
frequency and sweep rate increases, however, the band-
width must
be
widened
so
that the instrument can respond
properly.
Figure 3-24. Frequency Vs. Time (Log Sweep).
3-128. The 300
Hz
BANDWIDTH
is
the only bandwidth
that allows the instrument to respond properly over the
entire range
of
the log sweep. For this reason, the ADJUST
light comes
on
when any bandwidth other than 300 Hz
is
selected.
On
the 300Hz bandwidth, however, low frequency
measurements are not possible because the resolution
is
poor and the skirt produced
by
the zero response covers
nearly half
of
the display (Figure 3-25). For measurements
at low frequencies a narrower bandwidth must be used.
Table
34
lists the recommended bandwidths for measure-
ments
in
given
portions
of
the spectrum.
Table 3-4. Recommended Bandwidths (Log Sweep).
FREQUENCY
RECOMMENDED
RANGE
BANDWIDTH
20
Hz-200
Hz
10
Hz
200
Hz-982
Hz
30
Hz
982
Hz-9.82
kHz
100
Hz
9.82
kHz-43
kHz
300
Hz
3-129. The log sweep
is
intended primarily for making log
amplitude
vs.
log frequency plots
of
2-port devices. For this
application, the network
to
be tested
is
connected in the
closed-loop configuration where the rear panel Tracking
Oscillator Output supplies the stimulus and the 3580A
measures the response.
3-18
NOTE
Because
of
the relatively fast sweep rates used
in
·the Log sweep mode, conventional
X-
Y
recorders connected to the
rear
panel RE-
CORDER outputs cannot respond properly
during log sweeps (see
Paragraph
3-163).
I
I
20 Hz
982 Hz
Figure 3-25.
Log
Sweep (300
Hz
BW).
3-130. During closed loop measurements the bandwidth
limitations
are
not
quite
as
stringent
as
those previously
described. This
is
because the input frequency, derived
from the Tracking Oscillator Output, is always
in
or near
the center
of
the passband. The only requirement
is
that
the bandwidth be wide enough
to
permit the instrument
to
fully respond
to
amplitude variations introduced by the
network under test.
If
the network under test does
not
have
extremely steep skirts, a relatively narrow bandwidth can
be
used. For example, Figure 3-26
is
a log amplitude
vs.
log
frequency plot
of
a 20 kHz notch filter. The plot
was
made
using a
30
Hz bandwidth.
3-13L The easiest way to select the proper bandwidth for
the log sweep is to start with a wide bandwidth such
as
100 Hz and then narrow the bandwidth until the amplitude
or shape
of
the response curve begins to change.
When
the
response curve starts
to
change, the bandwidth
is
too
narrow.
3-132.
Sweep
Time
and
Sweep
Rate.
3-133. Sweep Time Control. The front panel
SWEEP
TIME control provides 14 sweep time settings ranging from
0.01 second per division to 200 seconds per division. With
10 horizontal divisions, total sweep time ranges from
0.1
second to 2,000 seconds.
3-134. Sweep Rate. The sweep rate
in
Hz
per second
is
determined by the FREQ
SP
AN
and
SWEEP
TIME
settings:
R=~
T
Where:
R = sweep rate in Hz/sec
F
5
= FREQ
SP
AN
setting
T =
SWEEP
TIME setting