Model 3580A
GENERAL
OPERATING
INFORMATION
Section III
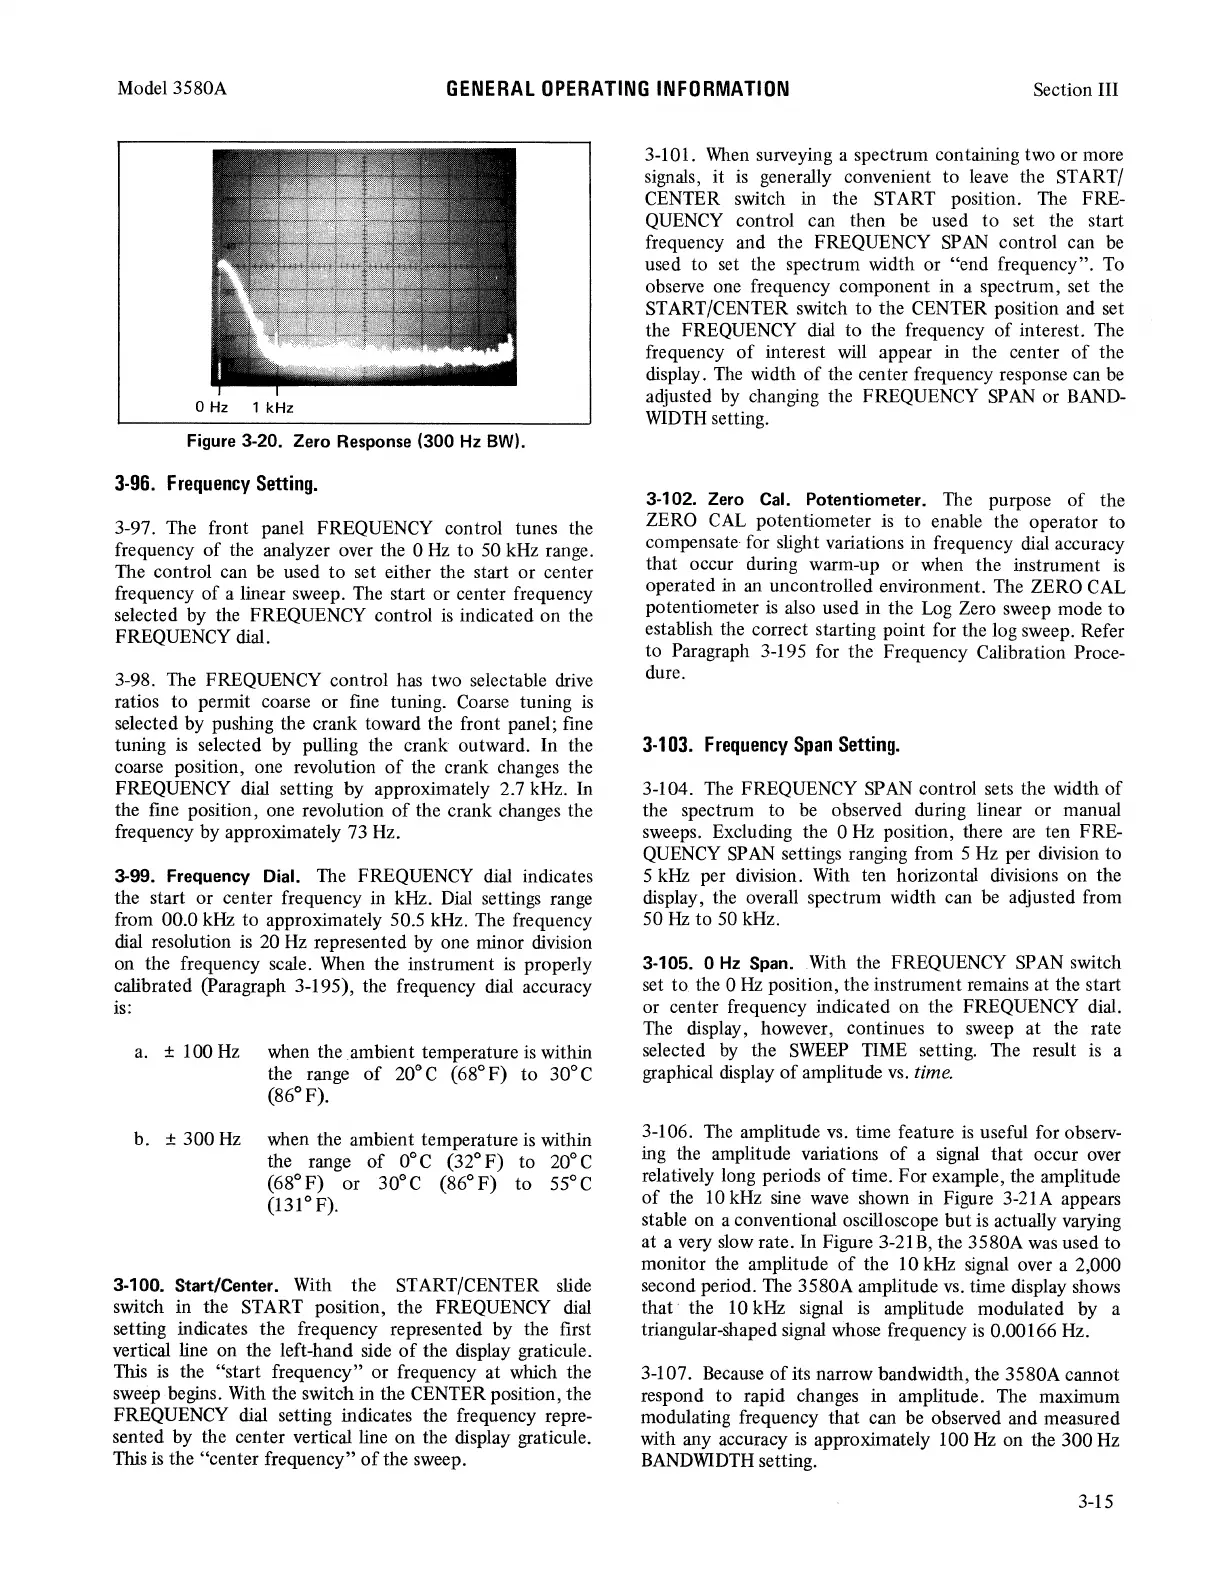
0 Hz 1 kHz
Figure
3-20. Zero
Response
(300
Hz
BW).
3-96.
Frequency
Setting.
3-97. The front panel FREQUENCY control tunes the
frequency
of
the analyzer over the 0
Hz
to
50 kHz range.
The control can be used
to
set either the start
or
center
frequency
of
a linear sweep. The start or center frequency
selected by the FREQUENCY control
is
indicated on the
FREQUENCY dial.
3-98. The FREQUENCY control has two selectable drive
ratios
to
permit coarse or fine tuning. Coarse tuning
is
selected by pushing the crank toward the front panel; fine
tuning
is
selected by pulling the crank outward. In the
coarse position, one revolution
of
the crank changes the
FREQUENCY dial setting by approximately 2.7 kHz. In
the fine position, one revolution
of
the crank changes the
frequency by approximately 73 Hz.
3-99.
Frequency
Dial. The FREQUENCY dial indicates
the start or center frequency in kHz. Dial settings range
from 00.0 kHz
to
approximately 50.5 kHz. The frequency
dial resolution is 20 Hz represented by one minor division
on the frequency scale. When the instrument
is
properly
calibrated (Paragraph 3-195), the frequency dial accuracy
is:
a. ± 100 Hz when the ambient temperature
is
within
the range
of
20" C ( 68°
F)
to
30° C
(86°F).
b. ±
300
Hz when the ambient temperature is within
the range
of
0° C (32°
F)
to
20° C
(68°
F)
or
30" C (86°
F)
to
55° C
(131° F).
3-100. Start/Center. With the START/CENTER slide
switch in the START position, the FREQUENCY dial
setting indicates the frequency represented by the first
vertical line on the left-hand side
of
the display graticule.
This
is
the "start frequency" or frequency at which the
sweep begins. With the switch in the CENTER position, the
FREQUENCY dial setting indicates the frequency repre-
sented by the center vertical line
on
the display graticule.
This is the "center frequency"
of
the sweep.
3-101.
When
surveying a spectrum containing two
or
more
signals, it
is
generally convenient
to
leave the START/
CENTER switch in the START position. The FRE-
QUENCY control can then be used
to
set the start
frequency and the FREQUENCY
SP
AN
control can be
used
to
set the spectrum width or "end frequency". To
observe one frequency component in a spectrum, set the
START/CENTER switch
to
the CENTER position and set
the FREQUENCY dial
to
the frequency
of
interest. The
frequency
of
interest will appear in the center
of
the
display. The width
of
the center frequency response can be
adjusted by changing the FREQUENCY
SP
AN
or BAND-
WIDTH
setting.
3-102.
Zero
Cal.
Potentiometer. The purpose
of
the
ZERO CAL potentiometer
is
to
enable the operator to
compensate· for slight variations in frequency dial accuracy
that
occur during warm-up or when
the
instrument
is
operated
in
an uncontrolled environment. The ZERO CAL
potentiometer
is
also used in the Log Zero sweep mode
to
establish the correct starting point for the log sweep. Refer
to
Paragraph 3-195 for the Frequency Calibration Proce-
dure.
3-103.
Frequency
Span
Setting.
3-104. The FREQUENCY SPAN control sets the width
of
the spectrum to be observed during linear or manual
sweeps. Excluding the 0
Hz
position, there are ten FRE-
QUENCY
SP
AN
settings ranging from 5 Hz per division
to
5 kHz per division. With ten horizontal divisions on the
display, the overall spectrum width can be adjusted from
50
Hz
to
50 kHz.
3-105. 0
Hz
Span.
With the FREQUENCY SPAN switch
set
to
the 0 Hz position, the instrument remains at the start
or center frequency indicated on the FREQUENCY dial.
The display, however, continues
to
sweep at the rate
selected
by
the
SWEEP
TIME setting. The result is a
graphical display
of
amplitude
vs.
time.
3-106. The amplitude vs. time feature
is
useful for observ-
ing the amplitude variations
of
a signal
that
occur over
relatively long periods
of
time. For example, the amplitude
of
the 10 kHz sine
wave
shown in Figure 3-21 A appears
stable on a conventional oscilloscope
but
is actually varying
at a very slow rate. In Figure 3-21B, the 3580A
was
used
to
monitor the amplitude
of
the 10 kHz signal over a 2,000
second period. The 3580A amplitude
vs.
time display shows
that the 10 kHz signal
is
amplitude modulated by a
triangular-shaped signal whose frequency
is
0.00166 Hz.
3-107. Because
of
its narrow bandwidth, the 3580A cannot
respond
to
rapid changes in amplitude. The maximum
modulating frequency that can be observed and measured
with any accuracy
is
approximately 100 Hz on the
300
Hz
BANDWIDTH
setting.
3-15