Model 3580A
Table
of
Contents
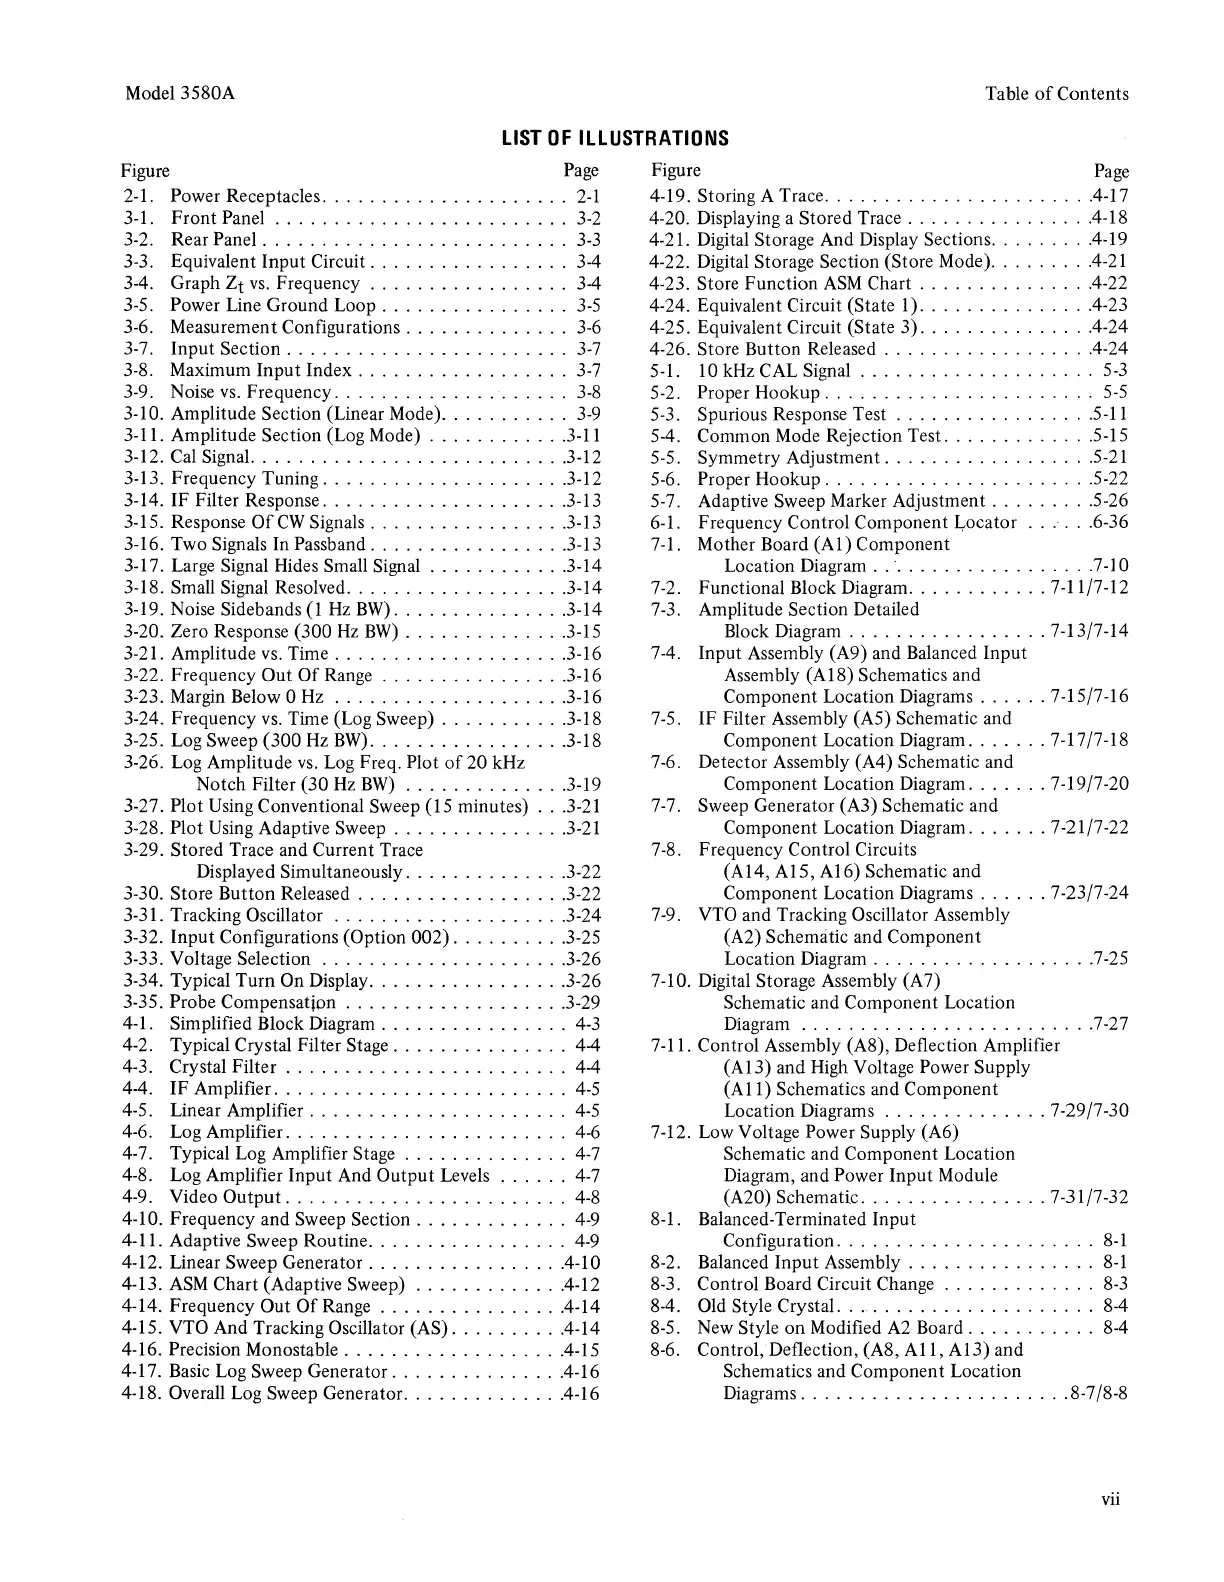
LIST
OF
ILLUSTRATIONS
Figure
Page
2-1. Power Receptacles. . . . . . . . . . . . . . . . . . . . .
2-1
3-1.
Front
Panel
.........................
3-2
3-2. Rear Panel . . . . . . . . . . . . . . . . . . . . . . . . . .
3-3
3-3. Equivalent Input Circuit
.................
34
3-4. Graph
Ztys.
Frequency . . . . . . . . . . . . . . . . .
34
3-5. Power Line Ground Loop
................
3-5
3-6. Measurement Configurations
..............
3-6
3-7. Input Section
........................
3-7
3-8. Maximum Input Index
..................
3-7
3-9. Noise
vs.
Frequency
....................
3-8
3-10. Amplitude Section (Linear Mode)
...........
3-9
3-11. Amplitude Section (Log Mode)
...........
.3-11
3-12. Cal Signal.
.........................
.3-12
3-13. Frequency Tuning
....................
.3-12
3-14. IF Filter Response
....................
.3-13
3-15. Response
Of
CW
Signals
................
.3-13
3-16. Two Signals In Passband
................
.3-13
3-17. Large Signal Hides Small Signal
...........
.3-14
3-18. Small Signal Resolved
..................
.3-14
3-19. Noise Sidebands
(1
Hz
BW)
. . . . . . . . . . . . . . .3-14
3-20. Zero Response (300
Hz
BW)
.............
.3-15
3-21. Amplitude
vs.
Time
...................
.3-16
3-22. Frequency Out
Of
Range
...............
.3-16
3-23. Margin Below 0 Hz
...................
.3-16
3-24. Frequency
vs.
Time (Log Sweep)
..........
.3-18
3-25. Log Sweep (300 Hz
BW)
................
.3-18
3-26. Log Amplitude
vs.
Log
Freq. Plot
of
20 kHz
Notch Filter (30
Hz
BW)
.............
.3-19
3-27. Plot Using Conventional Sweep (15 minutes)
..
.3-21
3-28. Plot Using Adaptive Sweep
..............
.3-21
3-29. Stored Trace and Current Trace
Displayed Simultaneously
.............
.3-22
3-30. Store Button Released
.................
.3-22
3-31. Tracking Oscillator
...................
.3-24
3-32. Input Configurations (Option 002)
.........
.3-25
3-33. Voltage Selection
....................
.3-26
3-34. Typical Turn On Display
................
.3-26
3-35. Probe Compensatjon
..................
.3-29
4-1. Simplified Block Diagram
................
4-3
4-2. Typical Crystal Filter Stage
...............
44
4-3. Crystal Filter
........................
44
4-4.
IF
Amplifier
.........................
4-5
4-5. Linear Amplifier . . . . . . . . . . . . . . . . . . . . . .
4-5
4-6. Log Amplifier
........................
4-6
4-7. Typical Log Amplifier Stage
..............
4-7
4-8. Log Amplifier Input And Output Levels
......
4-7
4-9. Video
Output.
.......................
4-8
4-10. Frequency and Sweep Section
.............
4-9
4-11. Adaptive Sweep Routine
.................
4-9
4-12. Linear Sweep Generator
.................
4-10
4-13.
ASM
Chart (Adaptive Sweep)
.............
4-12
4-14. Frequency Out
Of
Range
...............
.4-14
4-15. VTO And Tracking Oscillator (AS)
.........
.4-14
4-16. Precision Monostable
..................
.4-15
4-17.
Basic
Log Sweep Generator
...............
4-16
4-18. Overall Log Sweep Generator
.............
.4-16
Figure
Page
4-19. Storing A Trace
......................
.4-17
4-20. Displaying a Stored Trace
...............
.4-18
4-21. Digital Storage And Display Sections
........
.4-19
4-22. Digital Storage Section (Store Mode)
.........
4-21
4-23. Store Function
ASM
Chart
..............
.4-22
4-24. Equivalent Circuit (State
l)
..............
.4-23
4-25. Equivalent Circuit (State 3)
..............
.4-24
4-26. Store Button Released
.................
.4-24
5-1. 10 kHz CAL Signal
....................
5-3
5-2. Proper Hookup
......................
'
5-5
5-3. Spurious Response Test
................
.5-11
5-4. Common Mode Rejection Test.
...........
.5-15
5-5. Symmetry Adjustment
.................
.5-21
5-6. Proper Hookup
.......................
5-22
5-7. Adaptive Sweep Marker Adjustment
.........
5-26
6-1. Frequency Control Component Locator
......
6-36
7-1. Mother Board
(Al)
Component
Location Diagram
..
·
.................
7-10
7-2. Functional Block Diagram
............
7-11/7-12
7-3. Amplitude Section Detailed
Block Diagram
.................
7-13/7-14
7-4. Input Assembly (A9) and Balanced Input
Assembly
(Al8)
Schematics and
Component Location Diagrams
......
7-15/7-16
7-5. IF Filter Assembly (AS) Schematic and
Component Location Diagram. . .
....
7-1
7 /7-18
7-6. Detector Assembly (A4) Schematic and
Component Location Diagram
.......
7-19/7-20
7-7. Sweep Generator (A3) Schematic and
Component Location Diagram
.......
7-21
/7-22
7-8. Frequency Control Circuits
(Al4,
AlS,
Al6)
Schematic and
Component Location Diagrams
......
7-23/7-24
7-9.
VTO
and Tracking Oscillator Assembly
(A2) Schematic and Component
Location Diagram
...................
7-25
7-10. Digital Storage Assembly
(A
7)
Schematic and Component Location
Diagram
.........................
7-27
7-11. Control Assembly (A8), Deflection Amplifier
(A13) and
High
Voltage Power Supply
(All)
Schematics and Component
Location Diagrams
..............
7-29/7-30
7-12. Low Voltage Power Supply (A6)
Schematic and Component Location
Diagram, and Power Input Module
(A20) Schematic
................
7-31/7-32
8-1. Balanced-Terminated Input
Configuration. . . . . . . . . . . . . . . . . . . . . .
8-1
8-2. Balanced Input Assembly
..............
_ .
8-1
8-3. Control Board Circuit Change
.............
8-3
8-4. Old Style Crystal. . . . . . . . . . . . . . . . . . . . . . 8-4
8-5. New Style
on
Modified
A2
Board
...........
8-4
8-6. Control, Deflection, (A8,
All,
Al3)
and
Schematics and Component Location
Diagrams
.......................
8-
7 /8-8
vii