Radar Field Analyser - RFA641 Edition Date: 28-Feb-18
Clicking this button will evoke the View RFA pulses window, allowing you to view the recorded pulses
and to extract the antenna diagram (this is explained later on).
3.3.1. The Frequency Sweep Function
The RFA Recorder has a frequency sweep mode. This allows you to see pulse power, PRF or pulse count
versus frequency.
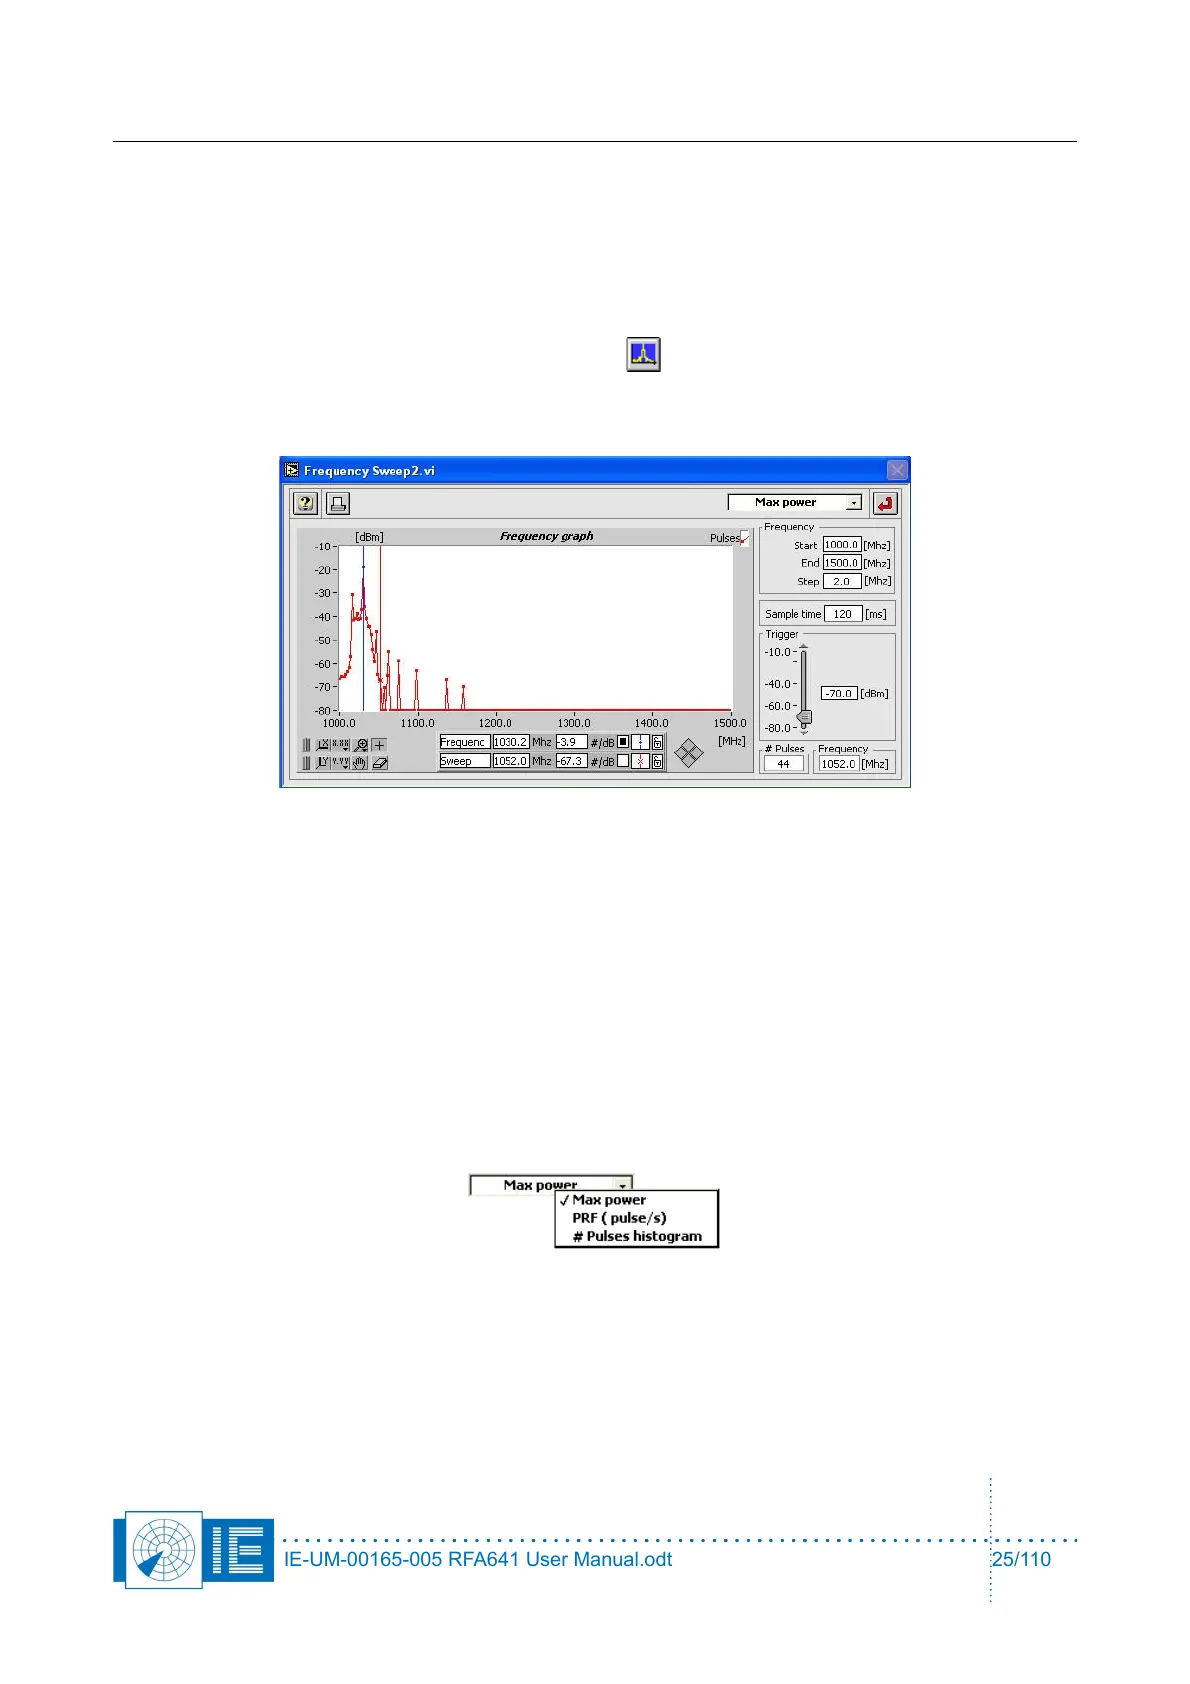
1. To load this function, click the Frequency Sweep button on the main RFA recorder screen. The
Frequency Sweep window will pop up.
The function can only be invoked when the RFA641 is set in Pulse mode.
The red cursor shows the instantaneous frequency of the RFA receiver.
The blue cursor can be manually set to a peak in the frequency graph. This way the radar under test
can be selected by frequency.
2. Now enter the following parameters:
• Start frequency: Determines the start frequency for the sweep.
• End frequency: Determines the end frequency for the sweep.
• Frequency step: Determines the frequency step for the sweep.
• Sampling time: Determines how long the frequency remains fixed.
The # pulses indicator shows the instantaneous number of received pulses, while the “Frequency
indicator shows the instantaneous frequency.
Select the mode of operation using the Y-scale switch:
• Max Power mode: maximum power (peak power) received on the scanned frequencies.
• PRF (pulses/s) mode: received pulses per second on the scanned frequencies.
• # Pulses histogram mode: the accumulated number of received pulses on the scanned
frequencies.
3. The frequency graph has a memory and always retains the highest value. Each time one of the
IE-UM-00165-005 RFA641 User Manual.odt 25/110