Radar Field Analyser - RFA641 Edition Date: 28-Feb-18
Note: The channel selection button is only used to select the correct Rx Calibration table
(correct channel). The measurement is a single channel measurement.
Once the measurement is started, the Sum, Delta and Omega buttons are dimmed. The
measurement will run through all power levels as determined by the RFA641’s power range and the
Power Step value. The number of scans required to perform the measurement can be calculated as:
2*(Pmax-Pmin)/Power Step. Each other scan you will see the power level being updated and a new
measurement performed.
For the measurement points exceeding the threshold level (quantised video pulse present), the
current Tx power level is filled in. For the measurement points not exceeding the threshold level, the
last measured threshold level is retained. This way the DSTC maps are built gradually as the
measurement proceeds.
You can await the end of the measurement or in case you decide the measured DSTC curve is
sufficient, you can click the Stop button to halt the measurement sequence.
By default the Z-scale (color) is auto scaled on the minimum and maximum of the loaded receiver
calibration file. The auto scale pad for the color display also contains a Z-axis auto scale button to
allow auto scaling on the Z-axis for the selected zoom in X-direction and Y-direction.
If wanted you can set the color scale manually in the Z-color scale control.
A red cursor is available in the sectorial DSTC graph to allow selecting an azimuth. The DSTC curve
for the selected azimuth is then displayed in the DSTC time graph. Range, azimuth and power level
of the selected point are indicated in the cursor readout.
7. When the measurement is finished, click the Save button to save the data to disk. The data will
be saved as an S4 plot file, containing one scan with a plot for each measurement point. The
following plot information fields are filled in: Range, Azimuth, Power level, Time and Scan Nr. This
data file can be viewed using the 3D View function of the Inventory as explained in section 4.6.4.
Viewing Sectorial STC and DSTC Measurement Files. The VI will prompt a standard file dialog, by
default pointing to the RESULTS subdirectory of the active campaign folder. Type in the desired file
name and save the data to disk.
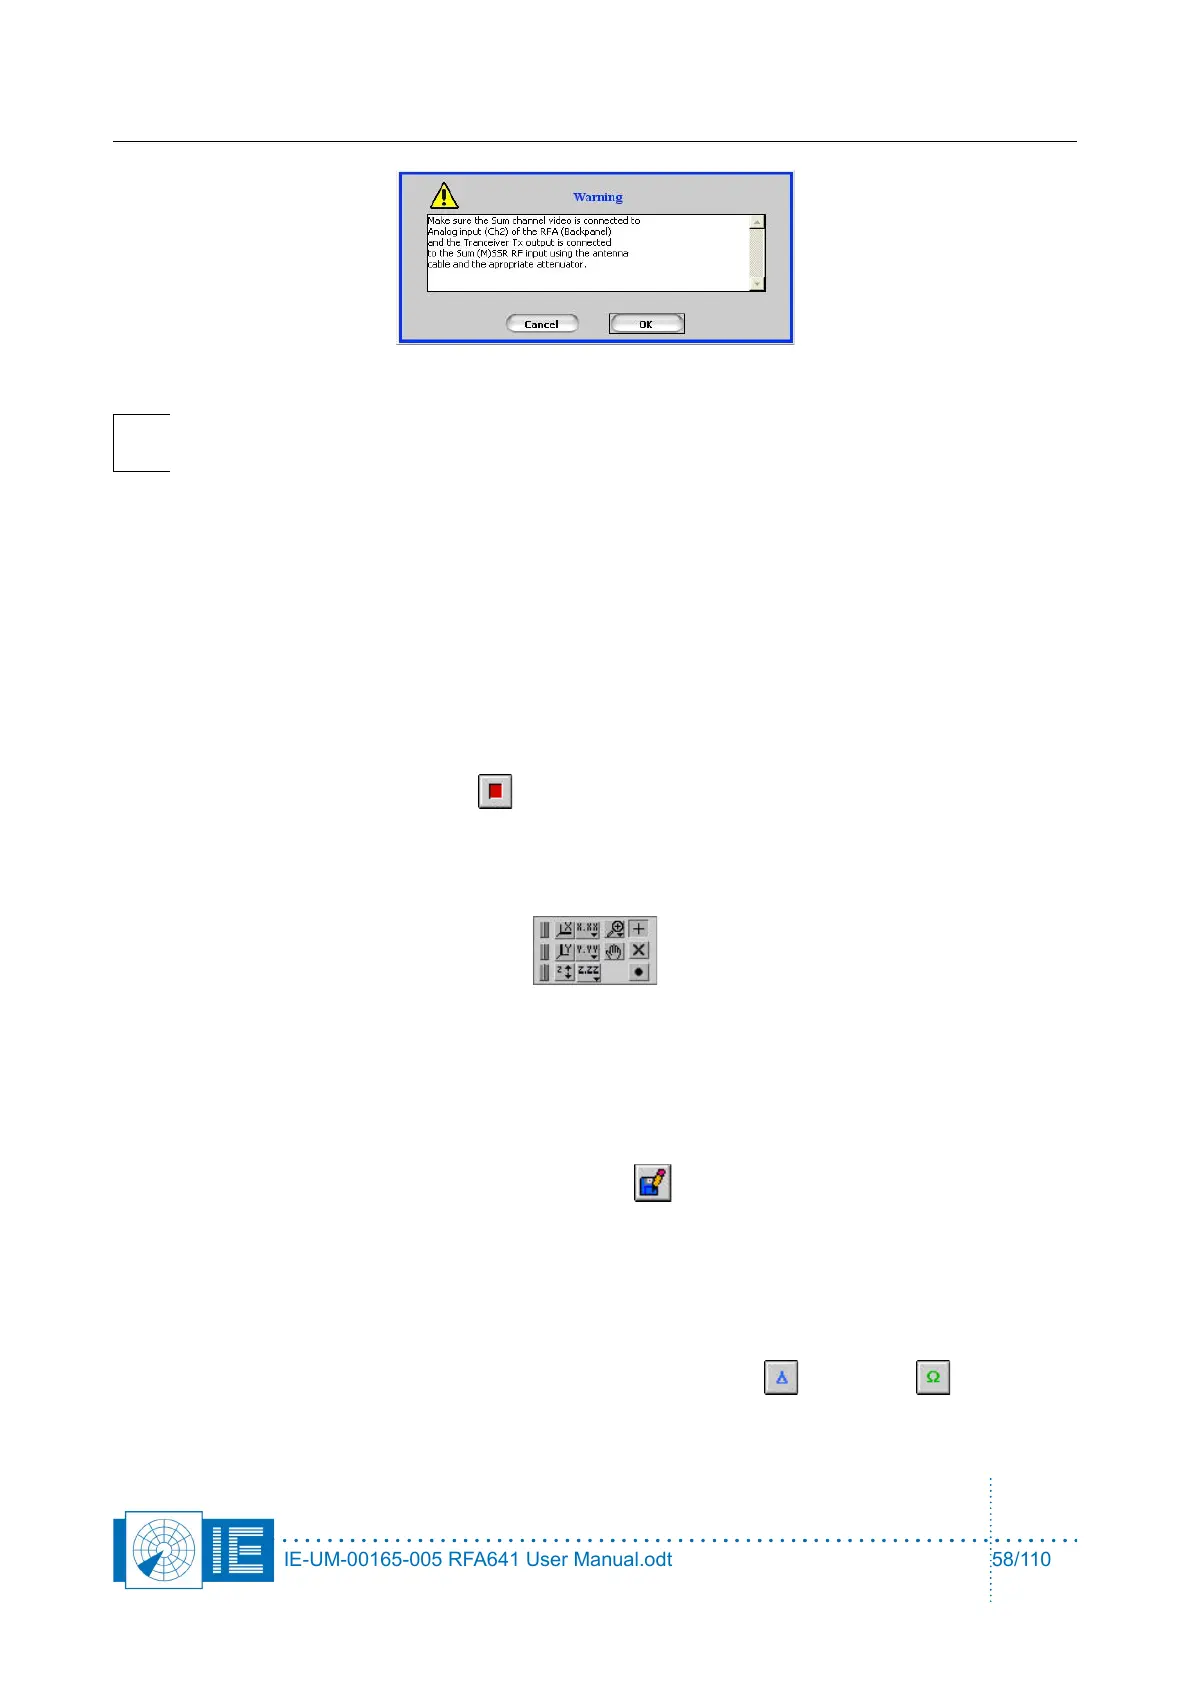
9. For MSSR stations: proceed with the measurements of the Delta and Omega channels.
Press the respective buttons on the software front panel, change the connections as described in the
pop-up window and repeat steps 6 and 7.
IE-UM-00165-005 RFA641 User Manual.odt 58/110