Radar Field Analyser - RFA641 Edition Date: 28-Feb-18
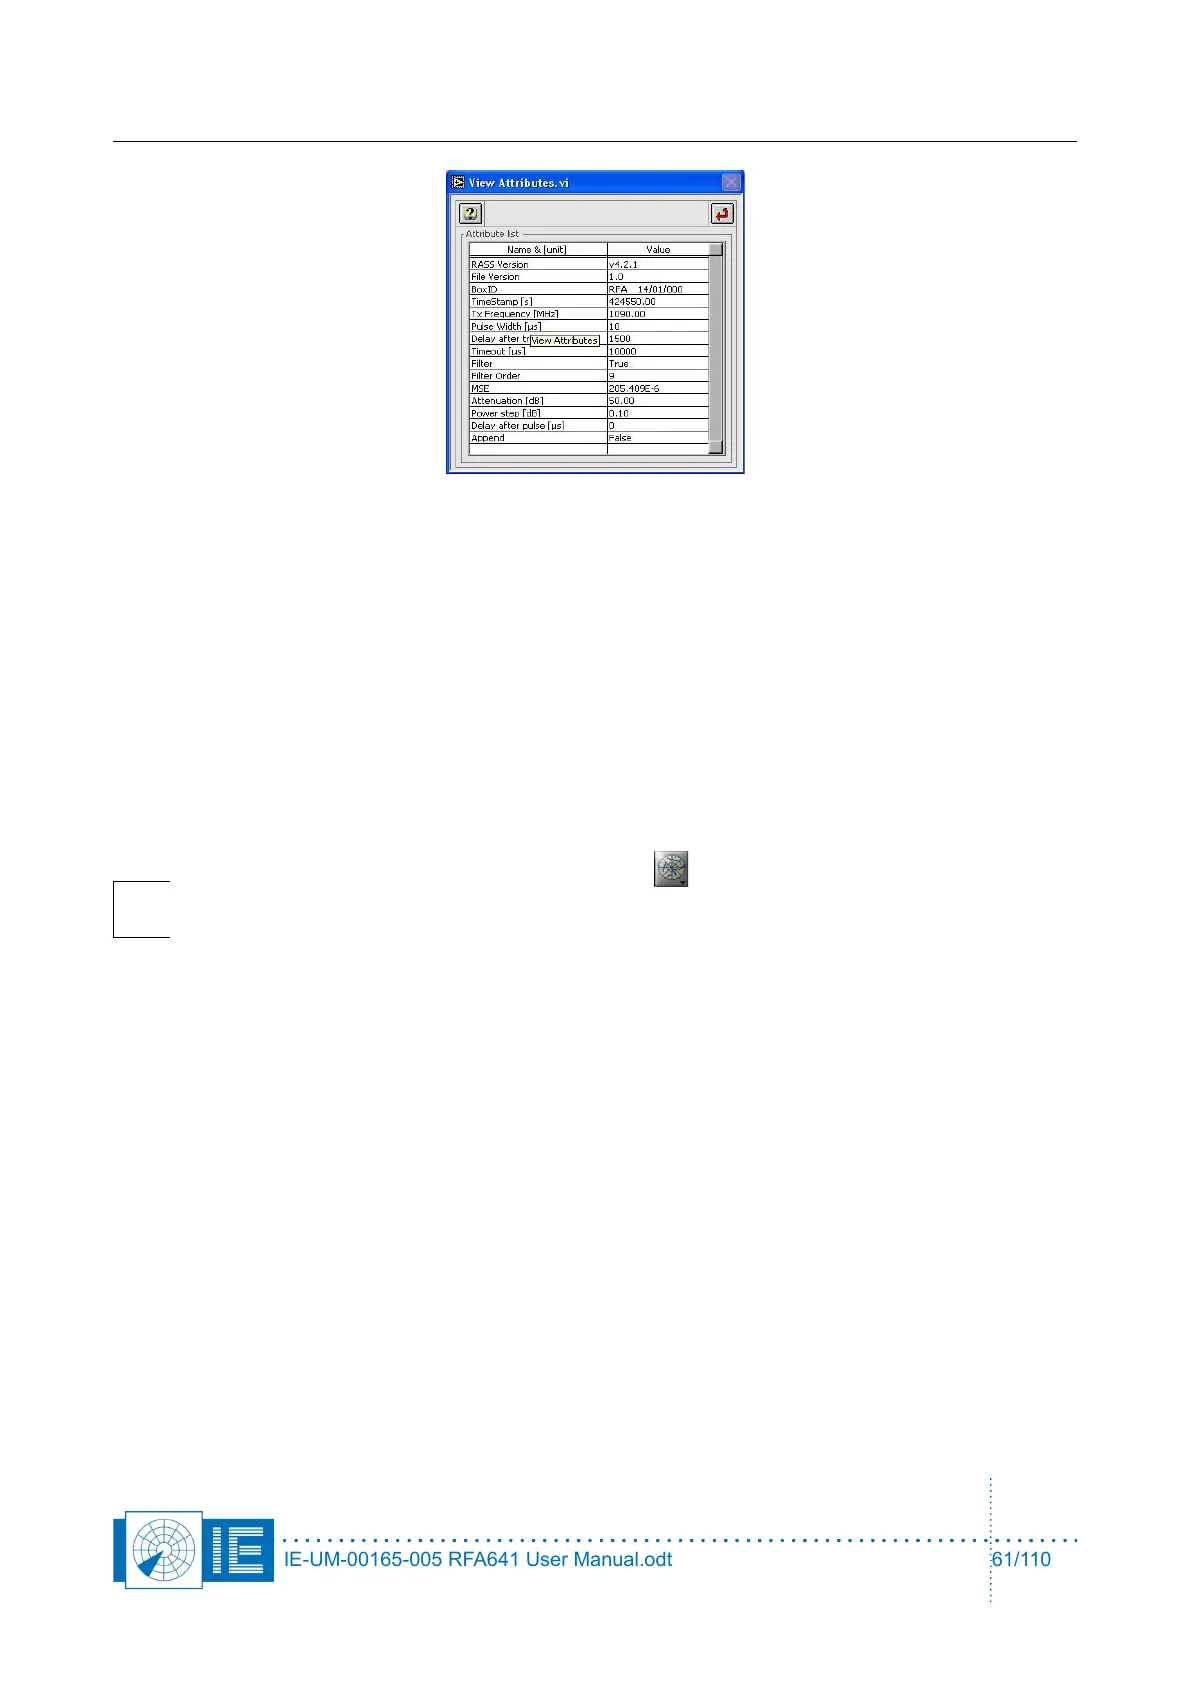
All related settings used to measure the curve are listed in this window.
4.6.4. Viewing Sectorial STC and DSTC Measurement Files
The sectorial STC and DSTC measurement programs save their data to an S4 plot file. This data can be
viewed in the Inventory. Two view methods are important:
• Power vs. time with filtering on azimuth to view the SCT/DSTC curve of a specific sector.
• 3D View of the entire measurement using Power[dBm] as Z-axis.
The following section will explain to you in detail how to use the Inventory to view the STC and DSTC
measurement files.
Note: Load the Inventory tool from the Analysis button of the RASS-S toolbox. More
information regarding the use of the Inventory is explained in the Inventory manual. This
document only describes the use of the Inventory as a sectorial (D)STC result viewer.
IE-UM-00165-005 RFA641 User Manual.odt 61/110