Radar Field Analyser - RFA641 Edition Date: 28-Feb-18
3. Click the OTD button to calculate the OTD parameters. The OTD window will appear. Click the
Return button after inspection.
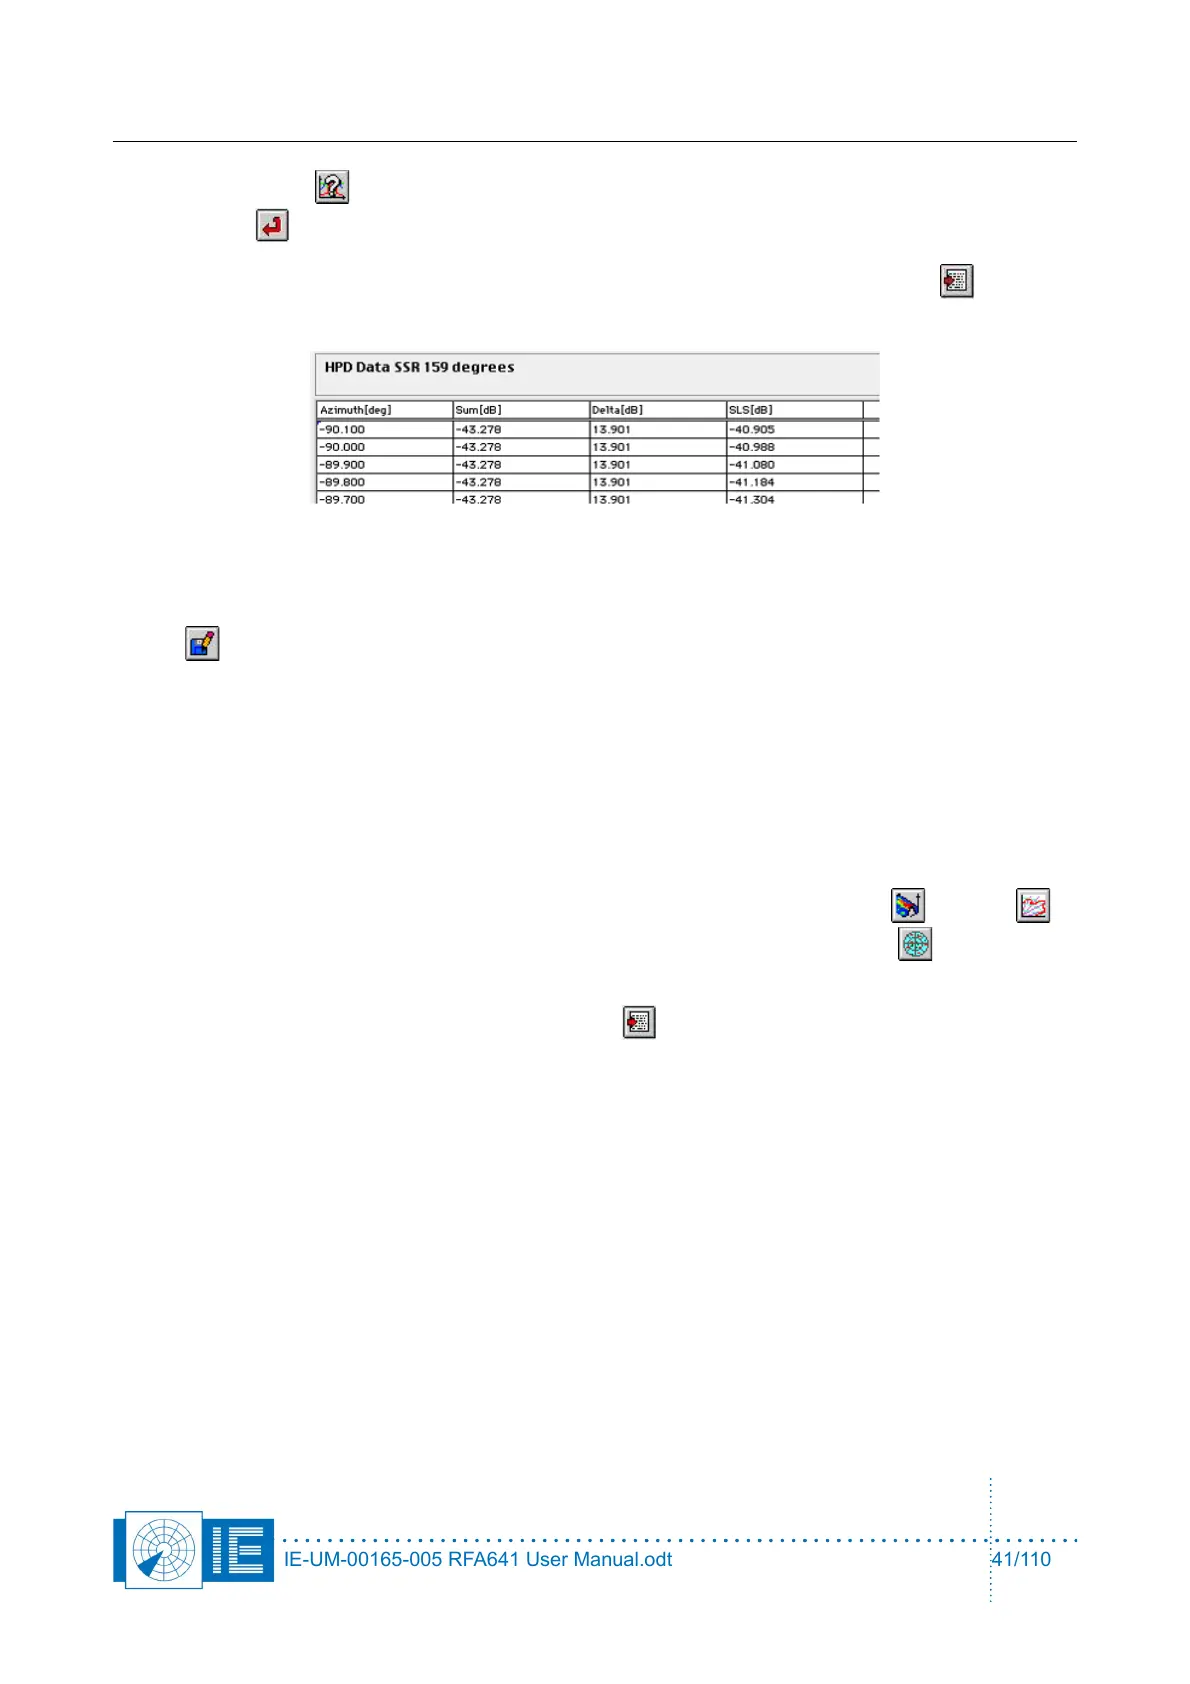
4. In case you have antenna diagram data available in a TAB-separated file, the Import function
can be used to load this file type into the selected layer. The software expects a diagram defined in
four columns: Azimuth [deg], Sum [dB], Delta [dB], SLS [dB]. The data points must be defined
equidistant in azimuth.
5. An existing logfile might consist of multiple measurements, from which you may want to select the
best ones to be kept in a separate logfile. This operation can easily be performed using the Save
button. Select the diagram you want to transfer to a new or existing logfile using the standard
procedure. (Start program and select a curve with the Index control.) Use the Save button to evoke
the Log panel. If no logfile has been selected yet: Open an existing logfile with the Open logfile
button or create a new logfile with the New Logfile button. In both cases a file dialog will appear.
The name of the newly selected logfile will be indicated in the Current Logfile string indicator. Use
the Add logging button to add the current data.
If a logfile has already been selected: In this case the logfile string indicates the selected file name.
Use the Add Logging button to append the current data to the logfile. Use the Cancel button to
cancel the operation.
6. If you recorded multiple HPD diagrams from different elevations, you can stack these on top of each
other and create VPD diagrams or 3D diagrams using the following buttons: 3D and VPD . It
is also possible to view the data in a polar view mode by clicking the Polar View button to
display the layers in polar mode.
7. The HPD data can be exported using the Export button. This will evoke a save file dialog,
pointing to the “Exports” subdirectory of the active campaign folder. The resulting file consists of a
text file containing a table. This table is TAB separated and can be imported by any Spreadsheet
program. The file consists of four columns: Azimuth [deg]; Sum Amplitude [dB]; Delta Amplitude [dB];
SLS Amplitude [dB]. The numerical data is converted in a string format with a 3-digit precision.
3.3.6.2. User Defined OTD Limits
(see section 3.3.5 User Defined OTD Limits )
IE-UM-00165-005 RFA641 User Manual.odt 41/110