Radar Field Analyser - RFA641 Edition Date: 28-Feb-18
By default the Z-scale (color) is auto scaled on the minimum and maximum of the loaded receiver
calibration file. The auto scale pad for the color display also contains a Z-axis auto scale button to
allow auto scaling on the Z-axis for the selected zoom in X-direction and Y-direction.
If wanted you can set the color scale manually in the Z-color scale control.
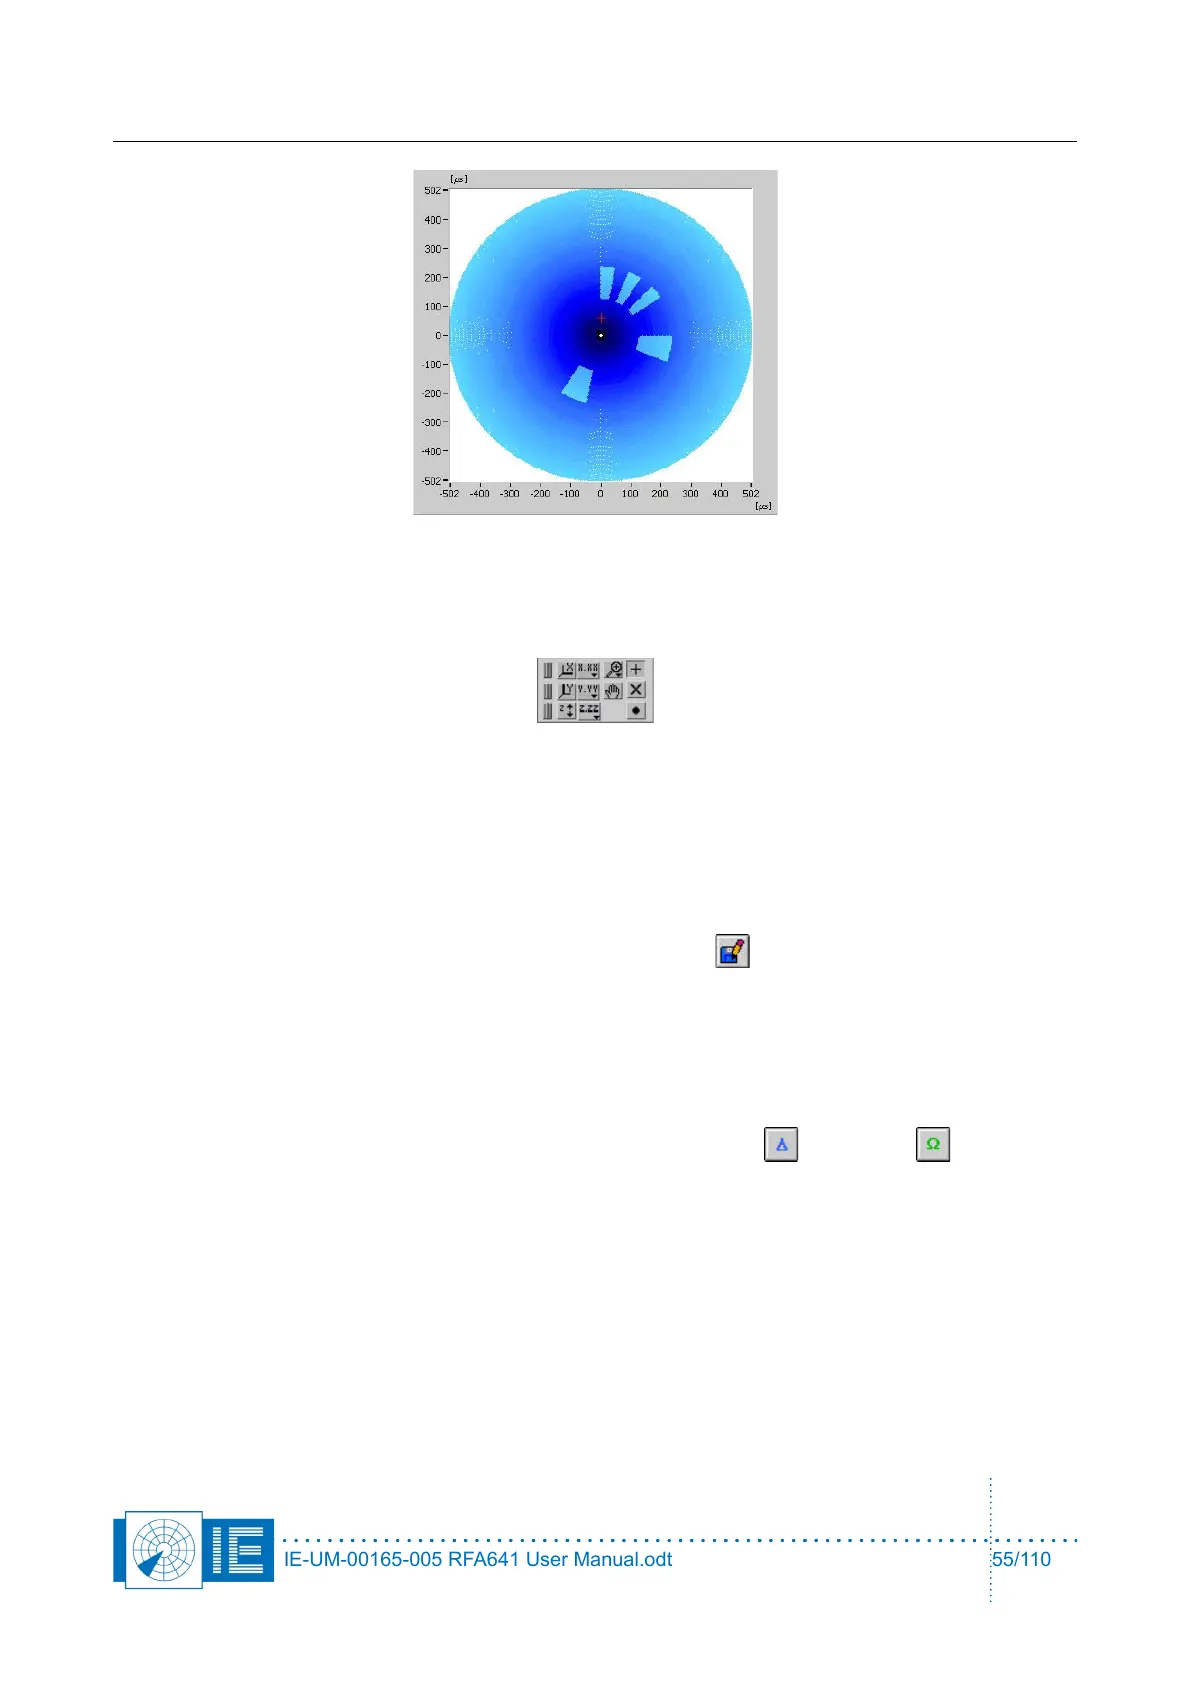
A red cursor is available in the Sectorial STC graph to allow selecting an azimuth. The STC curve for
the selected azimuth is then displayed in the STC time graph.
Range, azimuth and power level of the selected point are indicated in the cursor readout.
9. When the channels’ STC curve is measured, click the Save button to save the measurement
data to disk. The data will be saved as an S4 plot file, containing one scan with a plot for each
measurement point. The following plot information fields are filled in: Range, Azimuth, Power level,
Time and Scan Nr. This data file can be viewed using the 3D View function of the Inventory as
explained in section 4.6.4. Viewing Sectorial STC and DSTC Measurement Files. The VI will prompt
a standard file dialog, by default pointing to the RESULTS subdirectory of the active campaign folder.
Type in the desired file name and save the data on disk.
10. For MSSR stations: proceed with the measurements of the Delta and Omega channels.
Change the connections as described in the pop-up window and repeat steps 7 to 9.
IE-UM-00165-005 RFA641 User Manual.odt 55/110