MULTICAL®603
102
KamstrupA/S∙Technicaldescription∙5512‐2029
A1_GB
06.2017
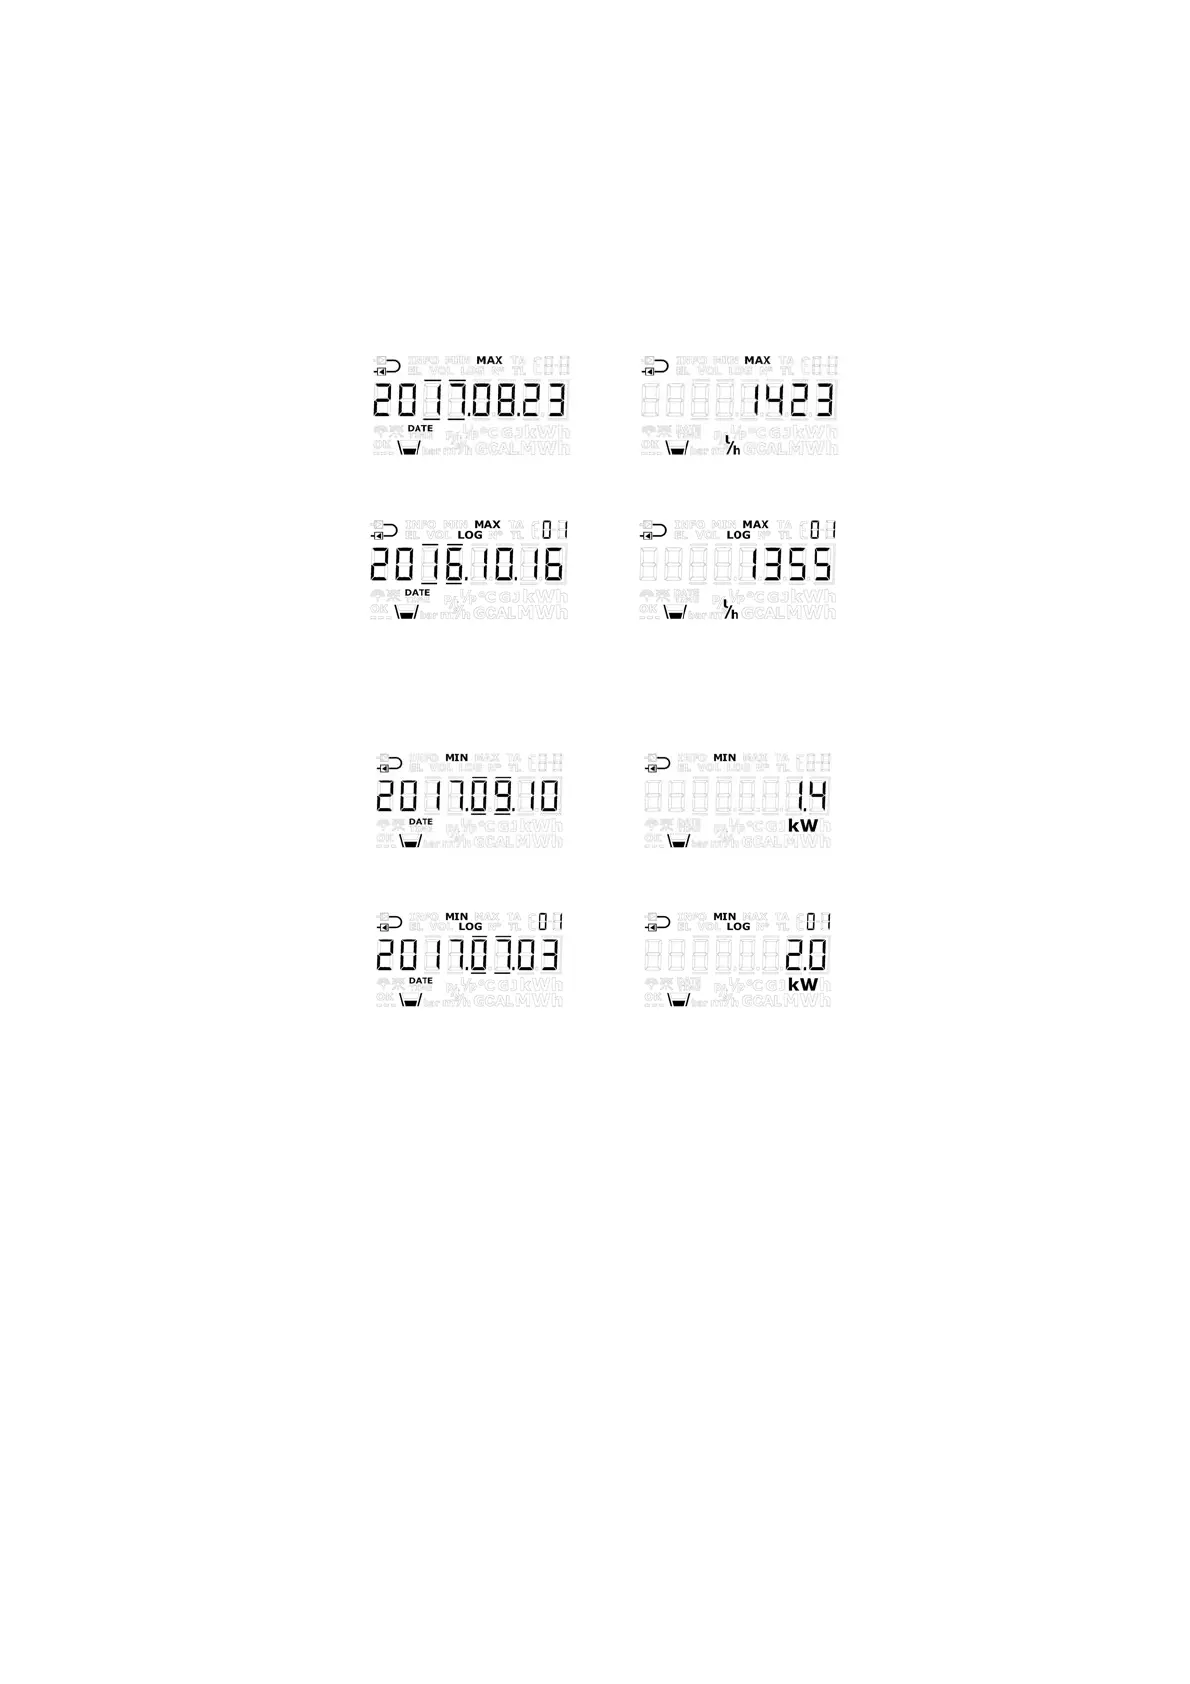
Belowareexamplesofdisplayreadingsofthedateanddatareadings.Theframesaroundthedateindicatewhether
thedateisconnectedtoyearlyormonthly data.Indatareadingsofyearlydatathelasttwodigitsoftheyearare
markedinframes,whereasthetwodigitsformonth
aremarkedformonthly data.Furthermore,thesymbols”MIN”
and”MAX”areilluminatedtoindicatewhetherthevaluesareminimumormaximumvalues.Thesymbol“LOG”is
illuminatedforhistoricalreadings.
Examplesofyearlydateanddata(maxvalues)forflow
Dateofmaxthisyear
Dataofmaxthis
year
Dateofmaxyearlylogger
Dataofmaxyearlylogger
Examplesofmonthlydateanddata(min.values)forpower
Dateofmin.thismonth
Dataofmin.thismonth
Dateofmin.monthlylogger
Dataofmin.monthlylogger
Allminimumandmaximumvaluesarecalculatedastheaverageofanumberofcurrentfloworpowermeasurements
dependingonthechosenaveragingperiod.Allcalculatedflowandpowervaluesfromtheaveraging periodareused
inthecalculatio noftheaverage.Calculatedvaluesarecomparedtopreviousvalues,and
thenewvalueissavedifit
exceedsthepreviousmaximumvalueorislowerthanthepreviousminimumvalue.Theaveragingperiodusedinall
calculationscanbeselectedintheinterval1...1440minutesinleapsof1minute(1440min.=24hours).Theaveraging
periodandthe
targetdatesarestatedintheorder.Readmoreaboutorderdatainparagraph3.3.Ifnototherwise
statedintheorder,thedefaultaveragingperiodof60minutesisused.ThisvaluecanlaterbechangedviatheSETUP
looporMETERTOOLHCW.
Pleasenotethefollowing:
Inthe
displaythedateisshownintheformat20YY.MM.DD,butbyserialreadingthetimecanbestatedtoo,
andtheformatthenbecomesYY.MM.DD,hh.mm.ss.
Theaverageiscalculatedcont inuouslyovertime,i.e.theaverageofvaluesiscalculatedfromnowonand
backintimeaccordingto
thechosenaveragingperiod.Asaresult,themin/maxcalculationisimmunetothe
clocksettingandwillalwaysmovecontinuouslythroughtime.