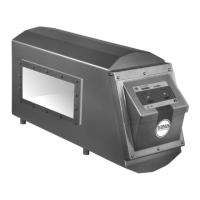
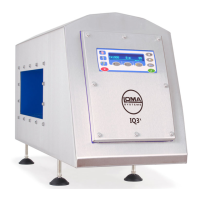
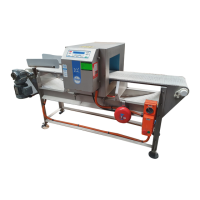
The User Interface
123
■ Stop bits
Tap the arrow to the right of the field to display a drop down list of options for selecting the
number of stop bits to be used for the connection.
■
Parity
Tap the arrow to the right of the field to display a drop down list of options for selecting the
parity to be used for the connection.
■
Flow control
Tap the arrow to the right of the field to display a drop down list of options for selecting the flow
control to be used for the connection.
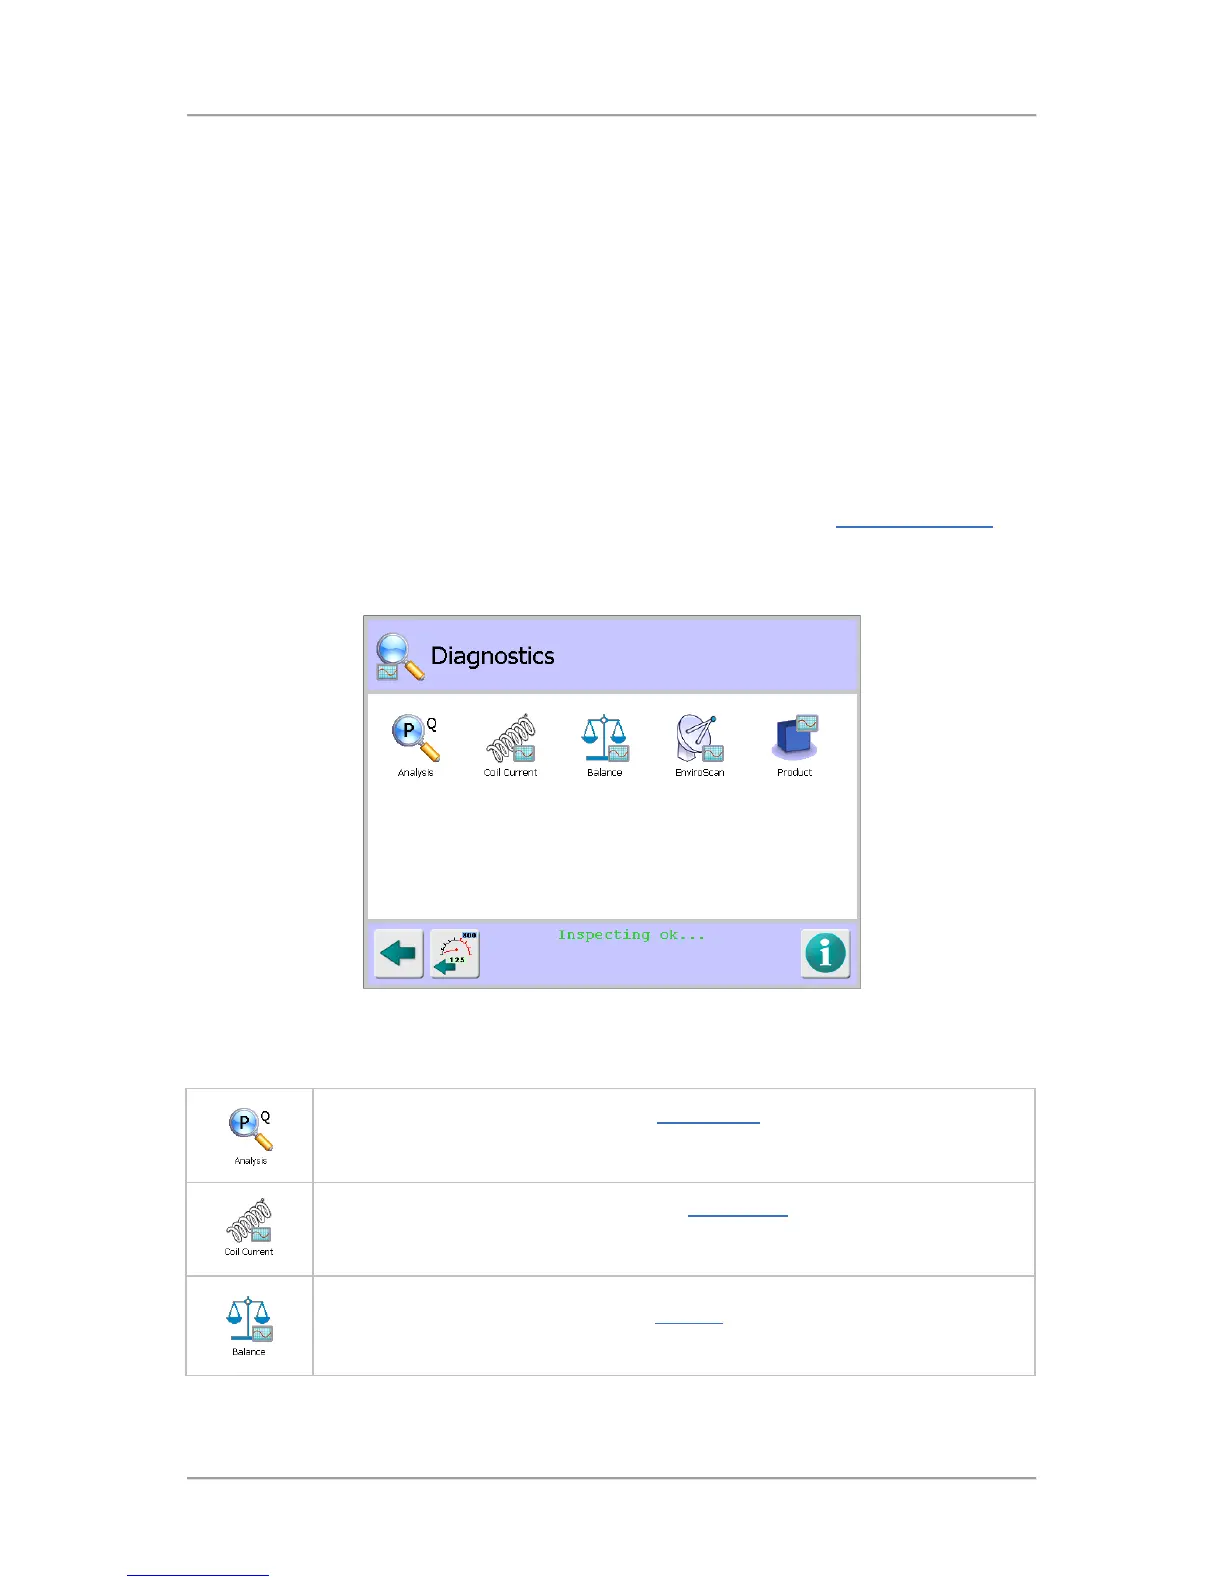
Diagnostics
Purpose
The Diagnostics screen is displayed by tapping on the Diagnostics icon in the Advanced Settings
screen.
The purpose of the screen is to provide access to a number of screens that provide real time data and
settings details to enable analysis of the detectors current performance.
Screen Contents
The screen contains a number of icons described in the table below which when selected provide
access to other screens.
Tap on the Analysis icon to display the PQ Analysis screen to view the current and
average P and Q signal values and adjust them manually or automatically if
necessary to achieve a balance.
Tap on the Coil Current icon to display the Coil Current screen which displays the
configuration and run current values and provides the option to restore the drive for
the frequency being used by the currently running products.
Tap on the Balance icon to display the Balance screen to display the frequency and
balance values for the current product.