117
Mahr GmbH • Digimar 817 CLM
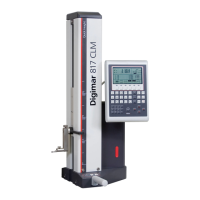
8.3 Control chart settings
1. <-_______
2. Enter production data text
3. x-bar S/R charts configuration
4. Menu Histogram
5. Menu x-bar S-charts
6. Pareto chart menu
1. Mean value / Sigma
2. Mean value / Range
1. Ford Q101
2. DGQ (Method A)
In conjunction with a measuring program the height
measuring instrument can both display and print (see
chapter 8.5) control charts. You can choose between a
sigma control chart and a range control chart. The
decision you make applies for all measuring programs.
Use the arrow keys to select the corresponding field.
You can then choose between the two standards Ford
Q101 and DGQ, which define the mathematical
formulae for the statistical calculations. Choose the
desired option with the arrow keys.
8.4 Statistics and histograms
A histogram is the diagram of the frequency
distribution of measured values. You proceed to
arrange the data according to size and divide the entire
range of the sample in k classes. This does not
necessarily have to be equally broad, however at least
classes equal in size simplify the interpretation within
the mid range.
Over each class a bar is established, whose surface is
proportional to a specific class frequency. If the surface
of the bar is equal to the absolute frequency the
histogram is absolute, if the relative frequency is used
then the histogram is known as a relative or
standardized.
Histograms are used when:
• it is assumed that several factors could affect a
process and these should be proven
• it is meaningful to define the specification limits for a
process
• it is desired to see the actual process of the
frequency distribution and not just single data such
as the mean and standard deviation
Histograms are the basis with the aid of a measuring
program to calculate measured and stored values
which fulfill the chosen selection criteria, see „8.4.5
Selection / sort criteria“
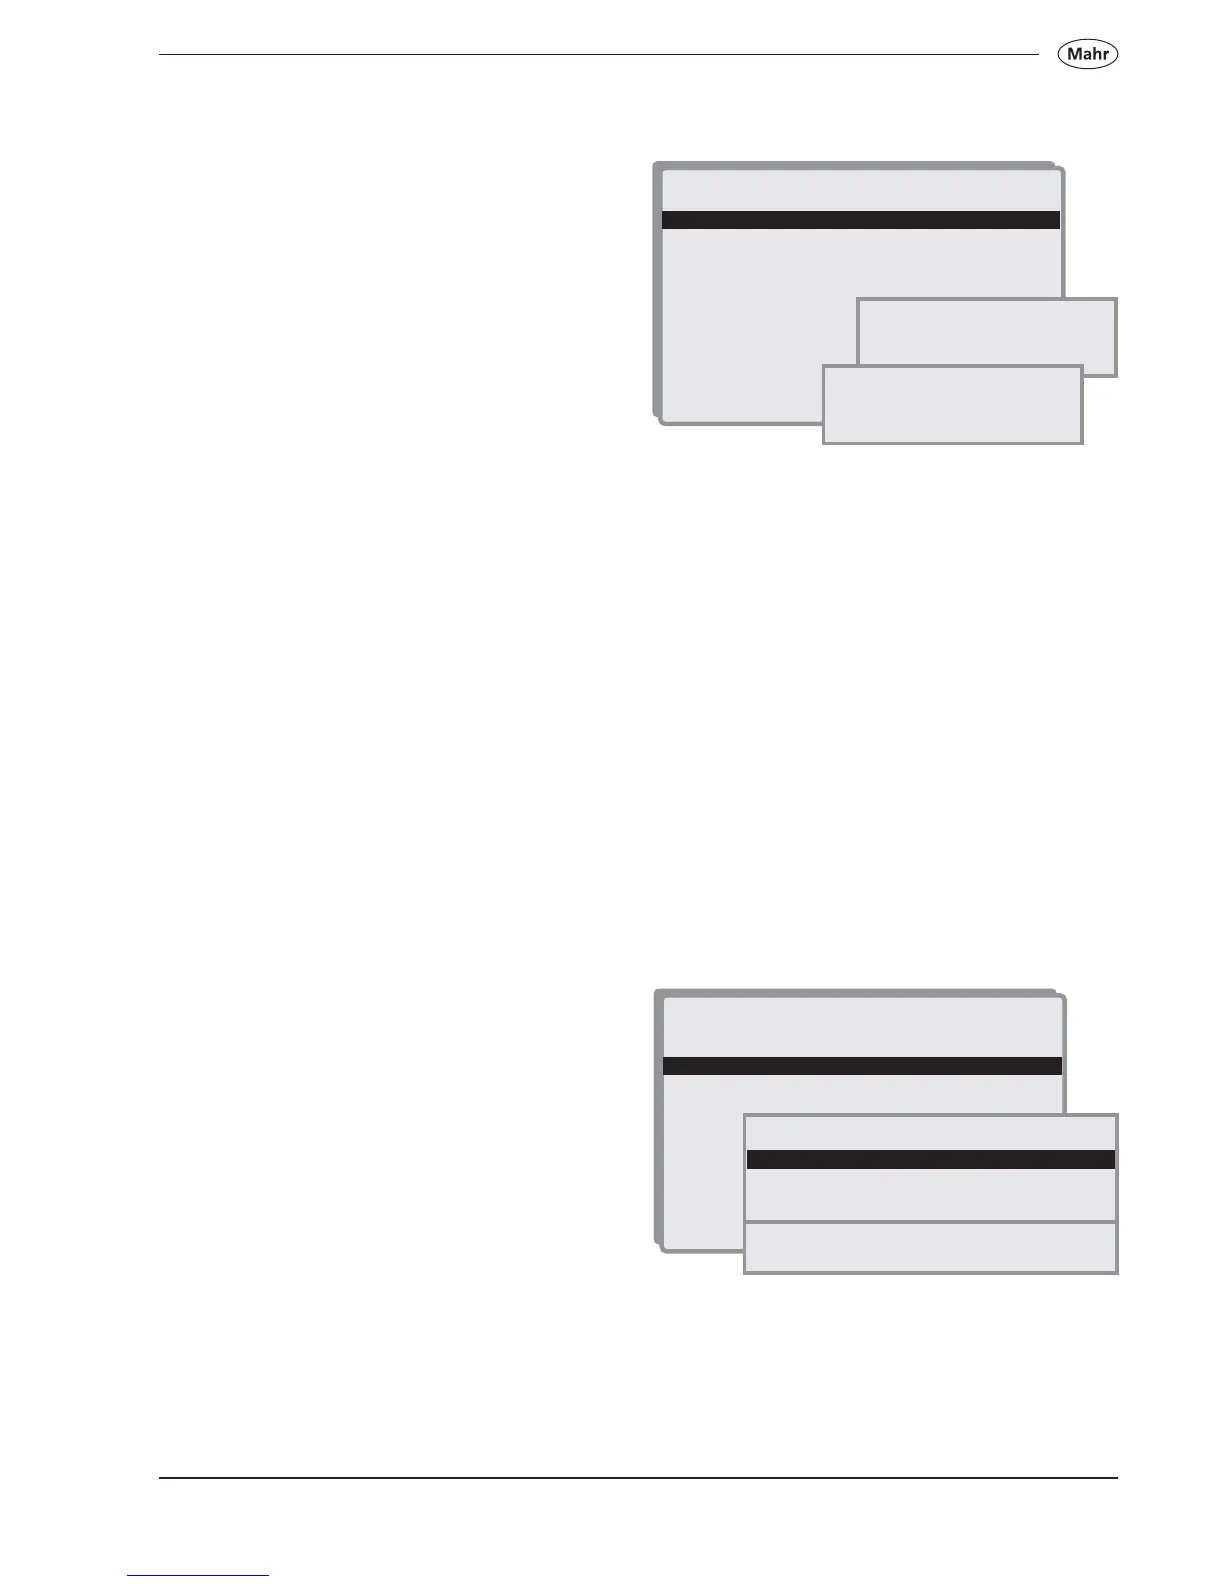
1. <-_______
2. Enter production data text
3. x-bar S/R charts configuration
4. Menu Histogram
5. Menu x-bar S-charts
6. Pareto chart menu
Statistic menu
PRG1 09:57 05/Sep/06 40 1
40/5000 read. 1/50 blocks 1/40 files
 Loading...