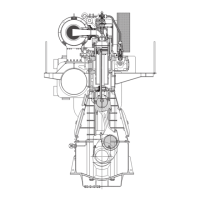
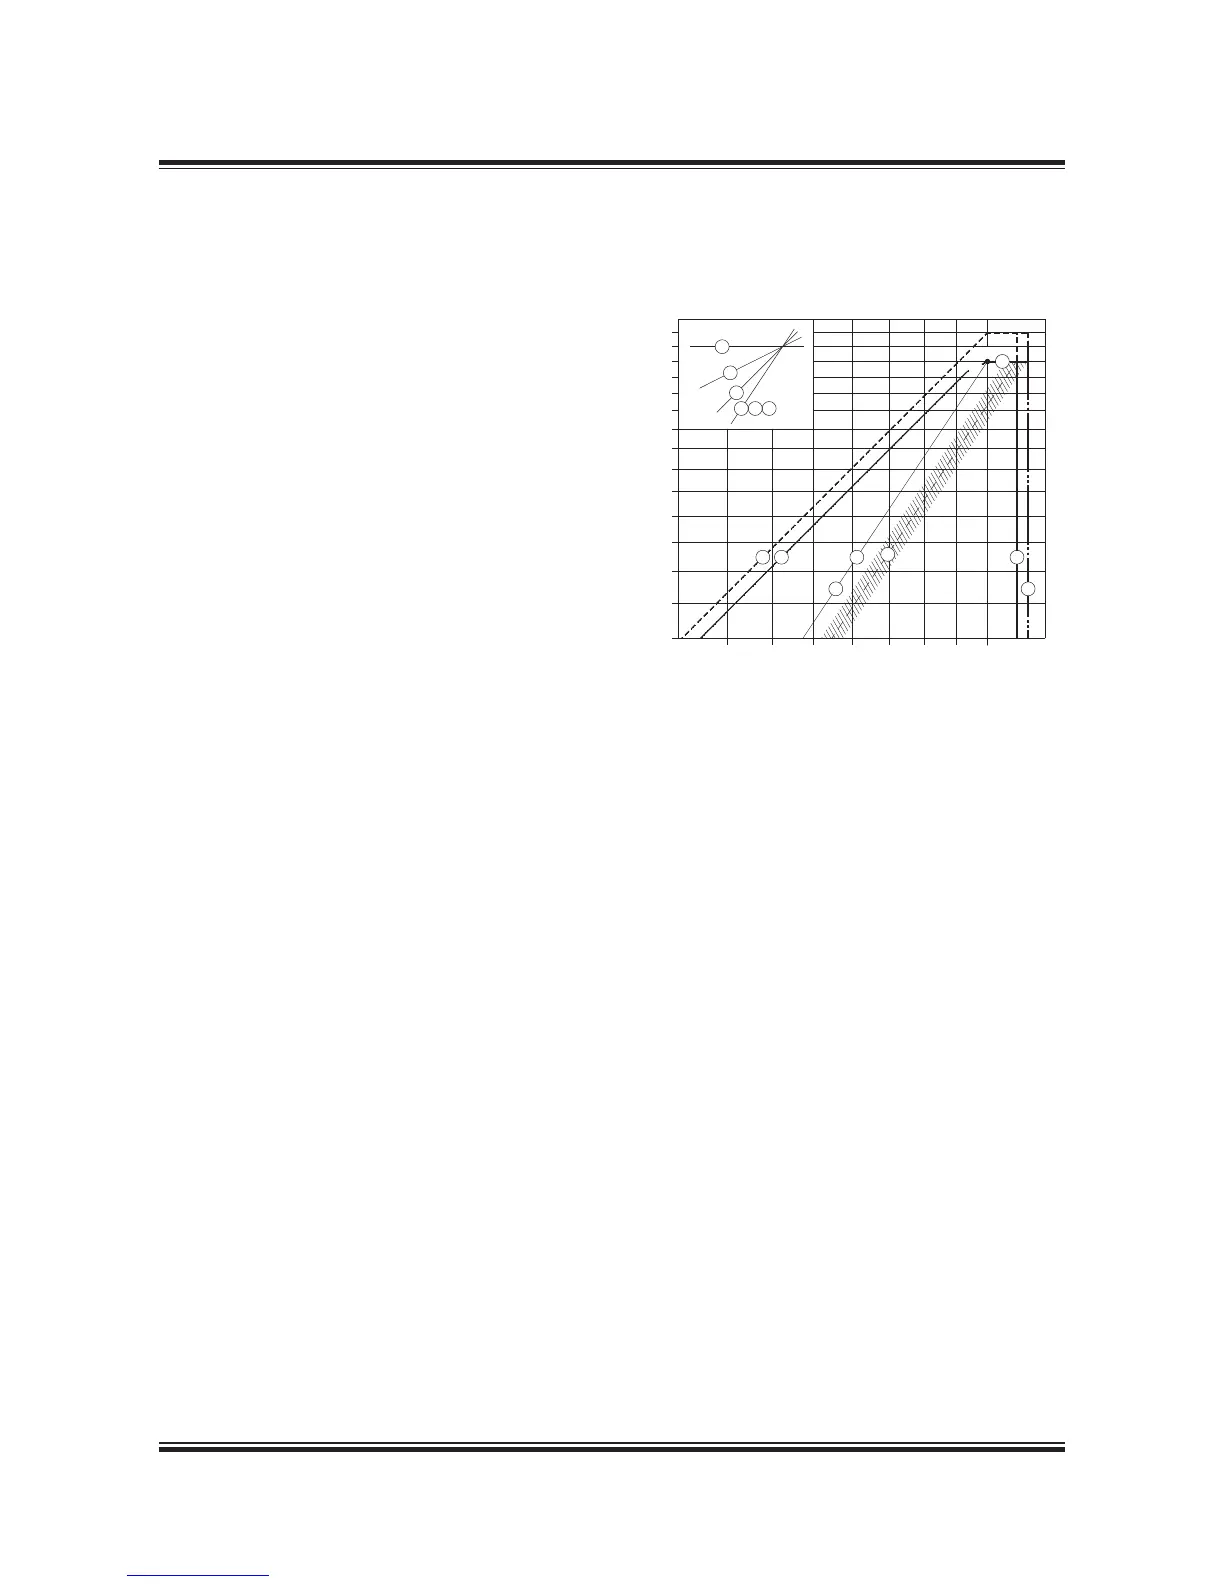
Engine shaft power, % of A
40
45
50
55
60
65
70
75
80
85
90
95
100
105
110
7
5
4
1 2
6
7
8
4
1
2
6
5
M
3
9
Engine speed, % of A
60
65
70
75
80
85 90 95 100 105 110
Definitions
The engine’s load diagram, see Fig. 2.04.02, de-
fines the power and speed limits for continuous as
well as overload operation of an installed engine
having a specified MCR point M that confirms the
ship’s specification.
The service points of the installed engine incorpo-
rate the engine power required for ship propulsion
and shaft generator, if installed.
Operating curves and limits for continuous
operation
The continuous service range is limited by four
lines: 4, 5, 7 and 3 (9), see Fig. 2.04.02. The pro-
peller curves, line 1, 2 and 6 in the load diagram
are also described below.
Line 1:
Propeller curve through specified MCR (M), en-
gine layout curve.
Line 2:
Propeller curve, fouled hull and heavy weather
– heavy running.
Line 3 and line 9:
Line 3 represents the maximum acceptable speed
for continuous operation, i.e. 105% of M.
During trial conditions the maximum speed may
be extended to 107% of M, see line 9.
The above limits may in general be extended to
105% and during trial conditions to 107% of the
nominal L
1
speed of the engine, provided the tor-
sional vibration conditions permit.
The overspeed setpoint is 109% of the speed
in M, however, it may be moved to 109% of the
nominal speed in L
1
, provided that torsional vibra-
tion conditions permit.
Running at low load above 100% of the nominal L
1
speed of the engine is, however, to be avoided for
extended periods. Only plants with controllable
pitch propellers can reach this light running area.
Line 4:
Represents the limit at which an ample air supply
is available for combustion and imposes a limita-
tion on the maximum combination of torque and
speed.
Regarding ‘i’ in the power function P = c x n
i
, see page 2.01.
M Specified MCR point
Line 1 Propeller curve through point M (i = 3)
(engine layout curve)
Line 2 Propeller curve, fouled hull and heavy weather
– heavy running (i = 3)
Line 3 Speed limit
Line 4 Torque/speed limit (i = 2)
Line 5 Mean effective pressure limit (i = 1)
Line 6 Propeller curve, clean hull and calm weather
– light running (i = 3), for propeller layout
Line 7 Power limit for continuous running (i = 0)
Line 8 Overload limit
Line 9 Speed limit at sea trial
178 05 427.6
Fig. 2.04.02: Standard engine load diagram
Engine Load Diagram
 Loading...