MI 2893 / MI 2892 / MI 2885 Events table
95
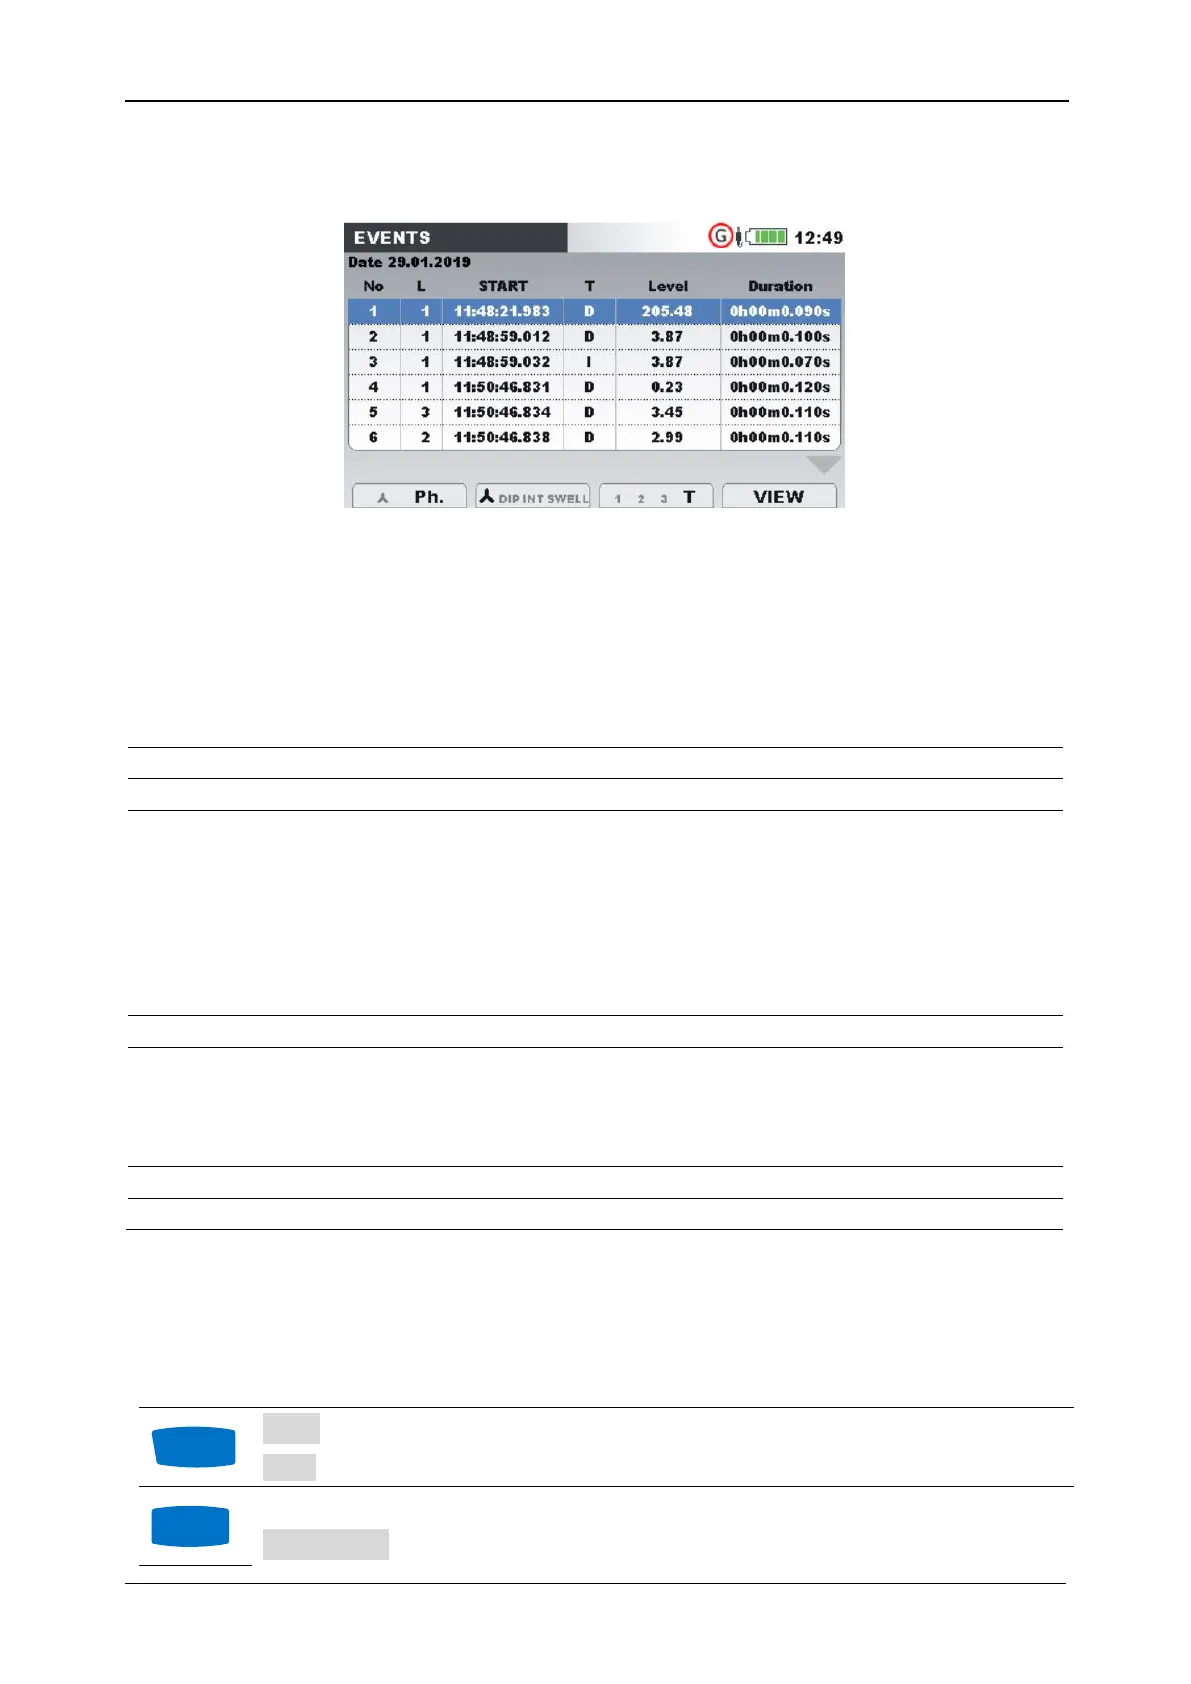
event number, event start time, duration and level. Additionally, in colon “T” type of event is shown (see
table below for details).
Figure 70: Voltage events screens
You can also see details of each individual voltage event and waveform/inrush view of all events.
Statistics show count registers for each individual event type by phase.
Table 74: Instrument screen symbols and abbreviations
Date when selected event has occurred
Unified event number (ID)
Indicate phase or phase-to-phase voltage where event has occurred:
1 – event on phase U
1
2 – event on phase U
2
3 – event on phase U
3
12 – event on voltage U
12
23 – event on voltage U
23
31 – event on voltage U
31
Event start time (when first U
Rms(1/2)
) value crosses threshold.
Indicates type of event or transition:
D – Dip
I – Interrupt
S – Swell
Minimal or maximal value in event U
Dip
, U
Int
, U
Swell
Table 75: Keys in Events table phase view screens
Group view is shown. Press to switch on “PHASE” view.
Phase view is shown. Press to switch on “GROUP” view.