17-1
17 Review
17.1 Accessing Respective Review Windows
Select [Main Menu]→[Review >>]. Then select [Graphic Trends], [Tabular Trends], [Events], or [Full Disclosure] to
access their respective review windows.
17.2 Reviewing Graphic Trends
In th
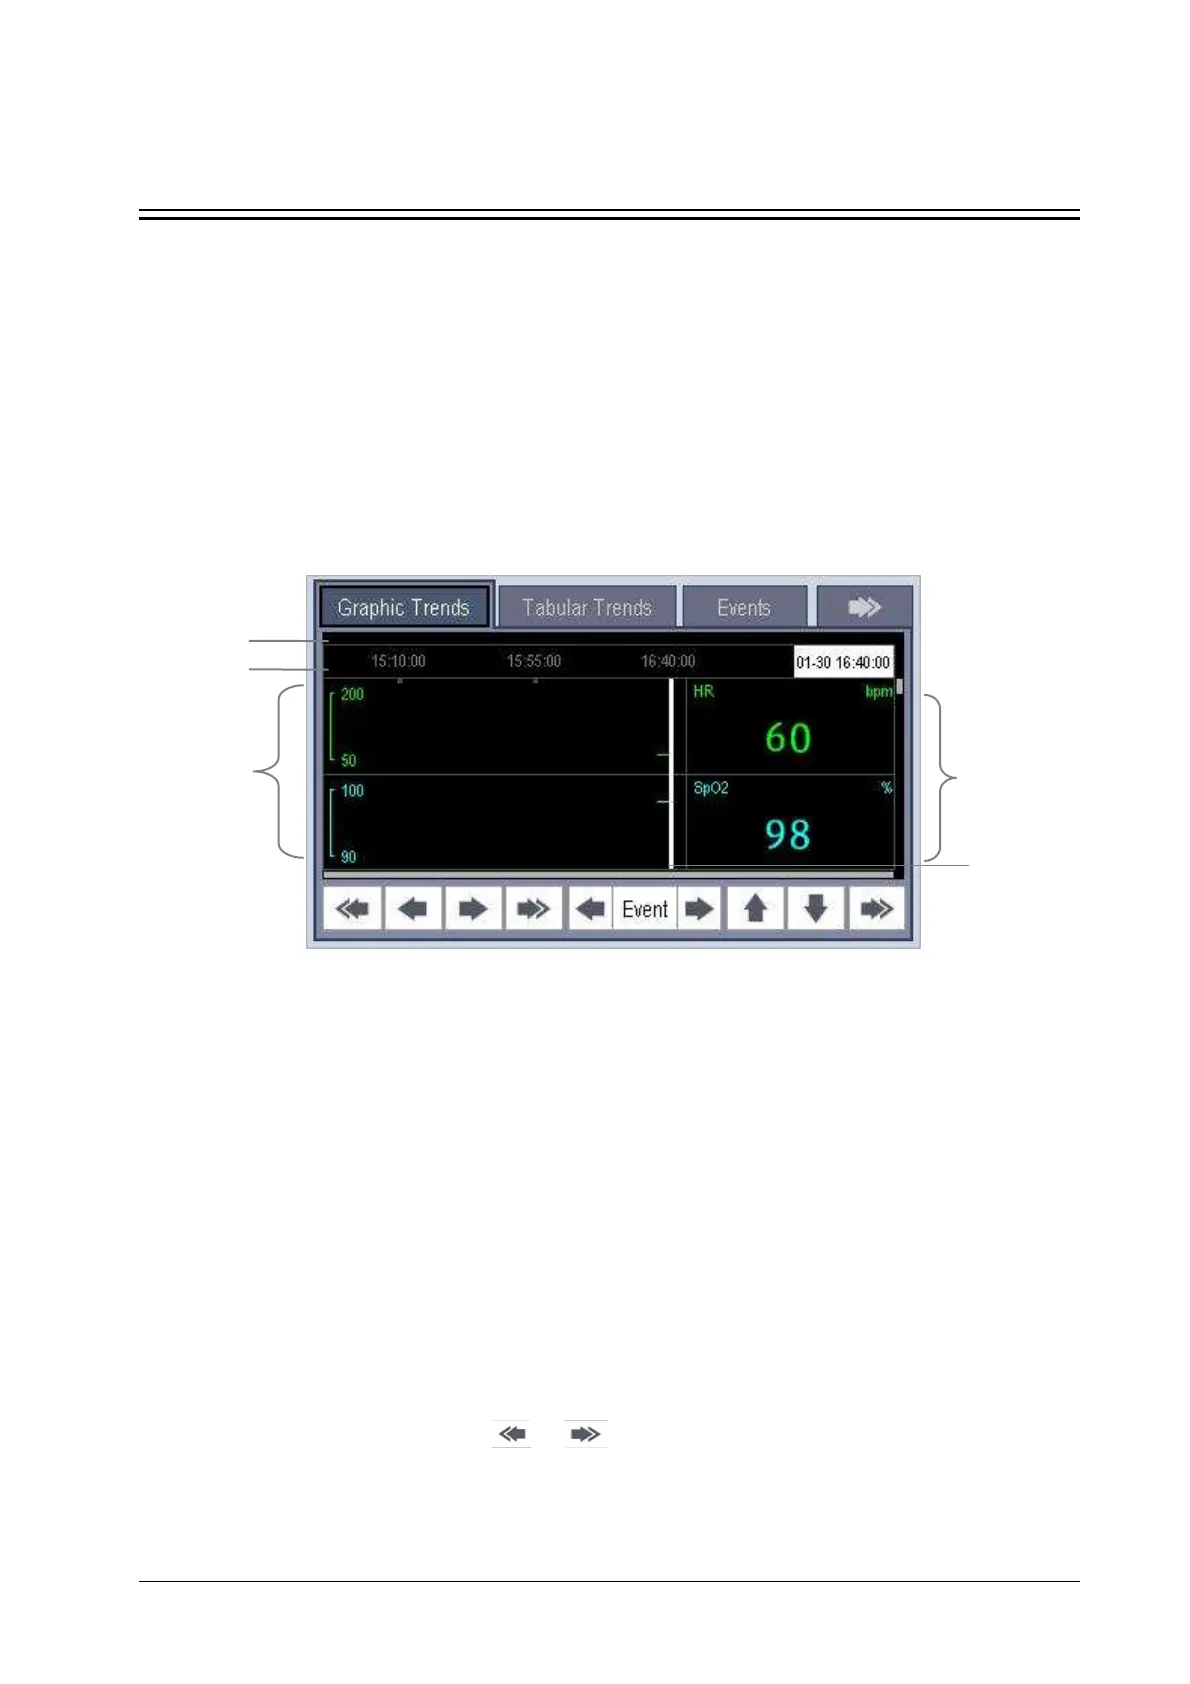
e [Review] menu, select [Graphic Trends] to access the following window.
1. Event mark area 2. Time axis 3. Graphic trends area
4. Parameter area 5. Cursor
Events are marked with colors in the event mark area. Red represents high level alarm event. Yellow represents
medium/low level alarm event. Green represents manual event.
In this review window:
Select a parameter scale in the graphic trends area to enter the corresponding scale menu. You can set the [Upper
Scale] or [Lower Scale] of Resp, ECG, SpO
2
, Temp, IBP, or NIBP when [Auto Scale] is [Off].
Select [Trend Group] and you can select a trend group for viewing in the popup menu. If [Custom 1] or [Custom 2]
is selected, you can further select [Define Trend Group]. Then you can select the parameters for viewing in the
popup menu.
You can set the time length of the review window by selecting [Zoom].
You can set the number of waves displayed in one page by selecting [Waves].
To browse the graphic trends, select
or to move the cursor one page to the left or right to navigate
through the graphic trends.
1
2
3
4
5