19-2
19.4 Starting Report Printouts
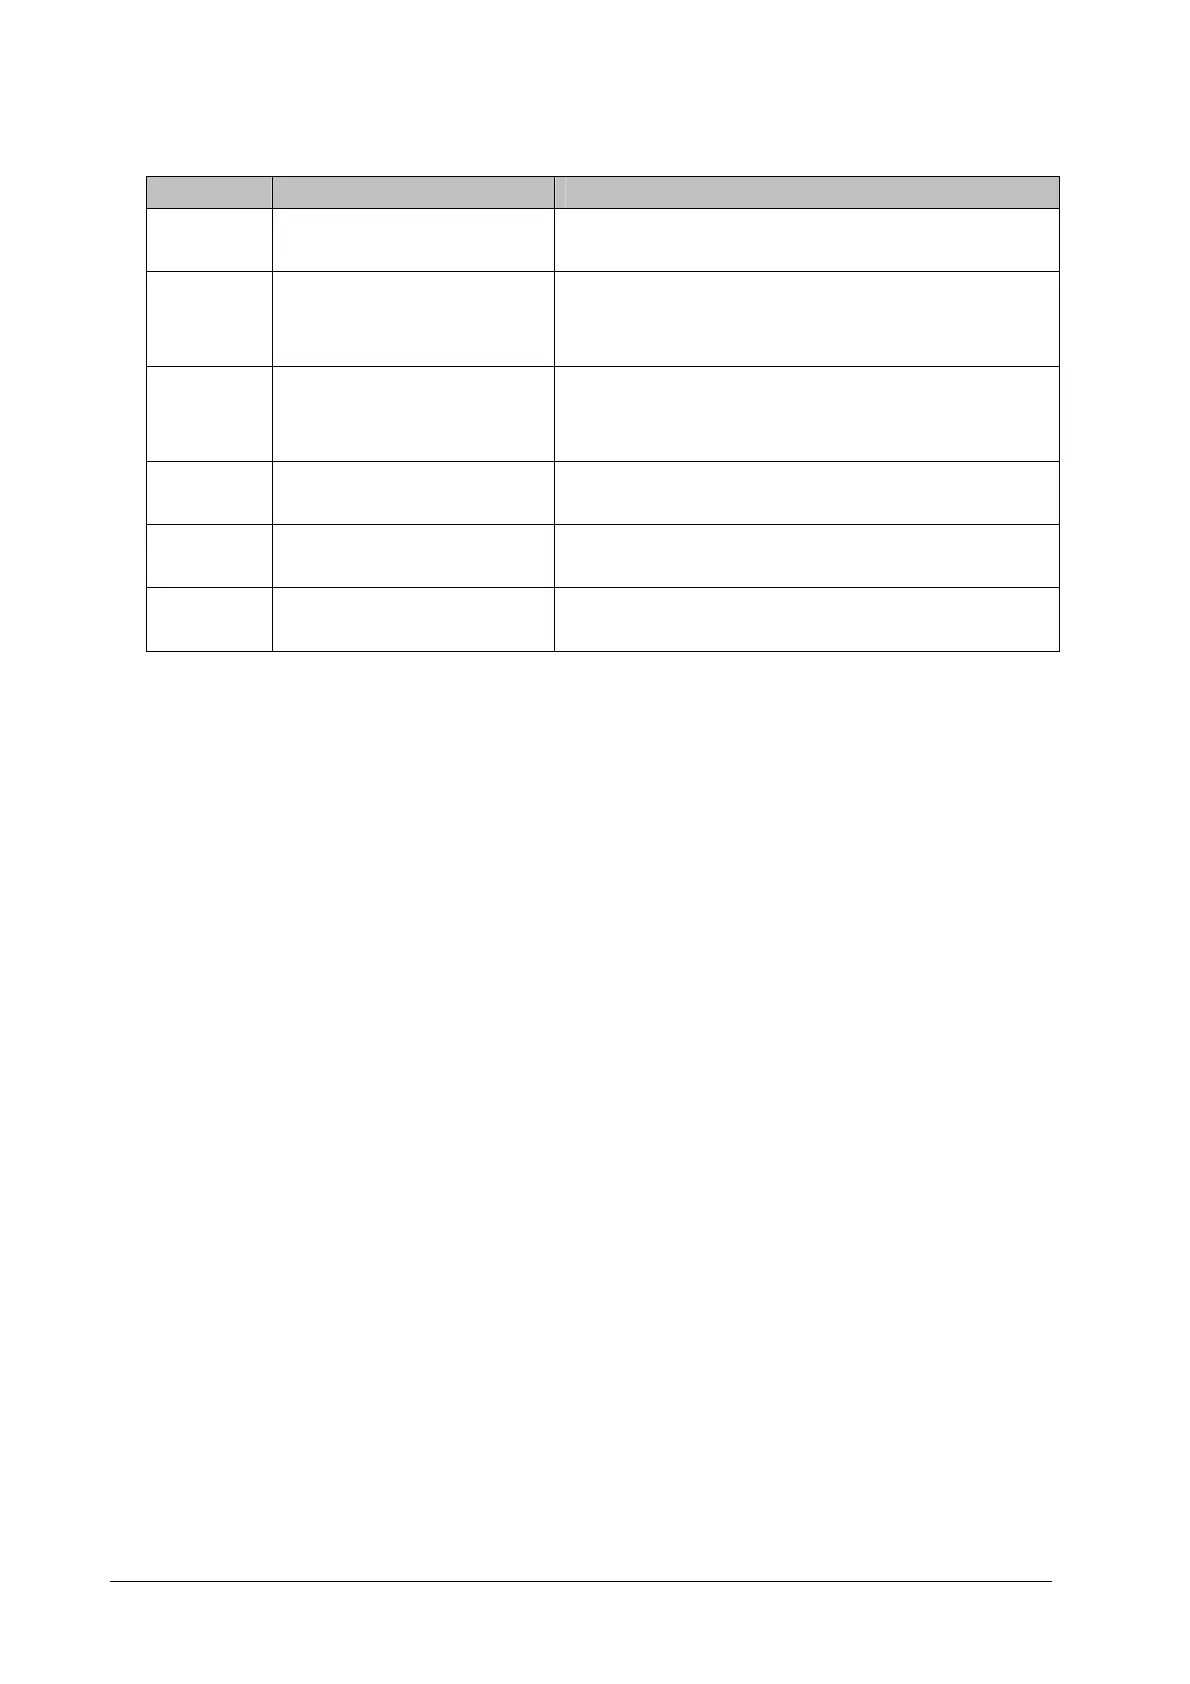
Reports Contents Procedures
ECG reports ECG waveforms and relevant
parameter values
Select [Main Menu]→[Print Setup >>]→[ECG Reports >>]→
[Print]
Tabular
trends
Depend on the selected
parameter group, resolution and
time period
Select [Main Menu]→[Print Setup >>]→[Tabular Trends
Reports >>]→[Print], or select [Main Menu]→[Review >>]→
[Tabular Trends]→[Print]→[Print]
Graphic
trends
Depend on the selected
parameter group, resolution and
time period
Select [Main Menu]→[Print Setup >>]→[Graphic Trends
Reports >>]→[Print], or select [Main Menu]→[Review >>]→
[Graphic Trends]→[Print]→[Print]
Arrh. events ECG waveforms and relevant
parameter values
Select [Main Menu]→[Review >>]→[Events] →[Arrh. Events]
→[Details] →[Print].
Parameter
alarm review
Depend on the selected alarms
Select [Main Menu]→[Alarm Setup >>]→[Parameters] →
[Print]
Realtime
waves
Depend on the selected
waveforms
Select [Main Menu]→[Print Setup >>]→[Realtime
Reports >>]→[Print]
19.5 Stopping Reports Printouts
To stop report printouts, select [Main Menu]→[Print Setup >>]→[Stop All Reports].
19.6 Setting Up Reports
19.6.1 Setting Up ECG Reports
You can print out ECG reports only under 7-lead or12-lead full screen. To set up ECG reports, select [Main Menu]→[Print
Setup >>]→[ECG Reports >>].
[Amplitude]: set the amplitude of the ECG waveforms.
[Sweep]: set the wave print speed to 25 mm/s or 50 mm/s.
[Auto Interval]: If [Auto Interval] is set to [On], the system will automatically adjust the space between waveforms
to avoid overlapping.
[Gridlines]: choose whether to show gridlines.