Image Optimization 5-27
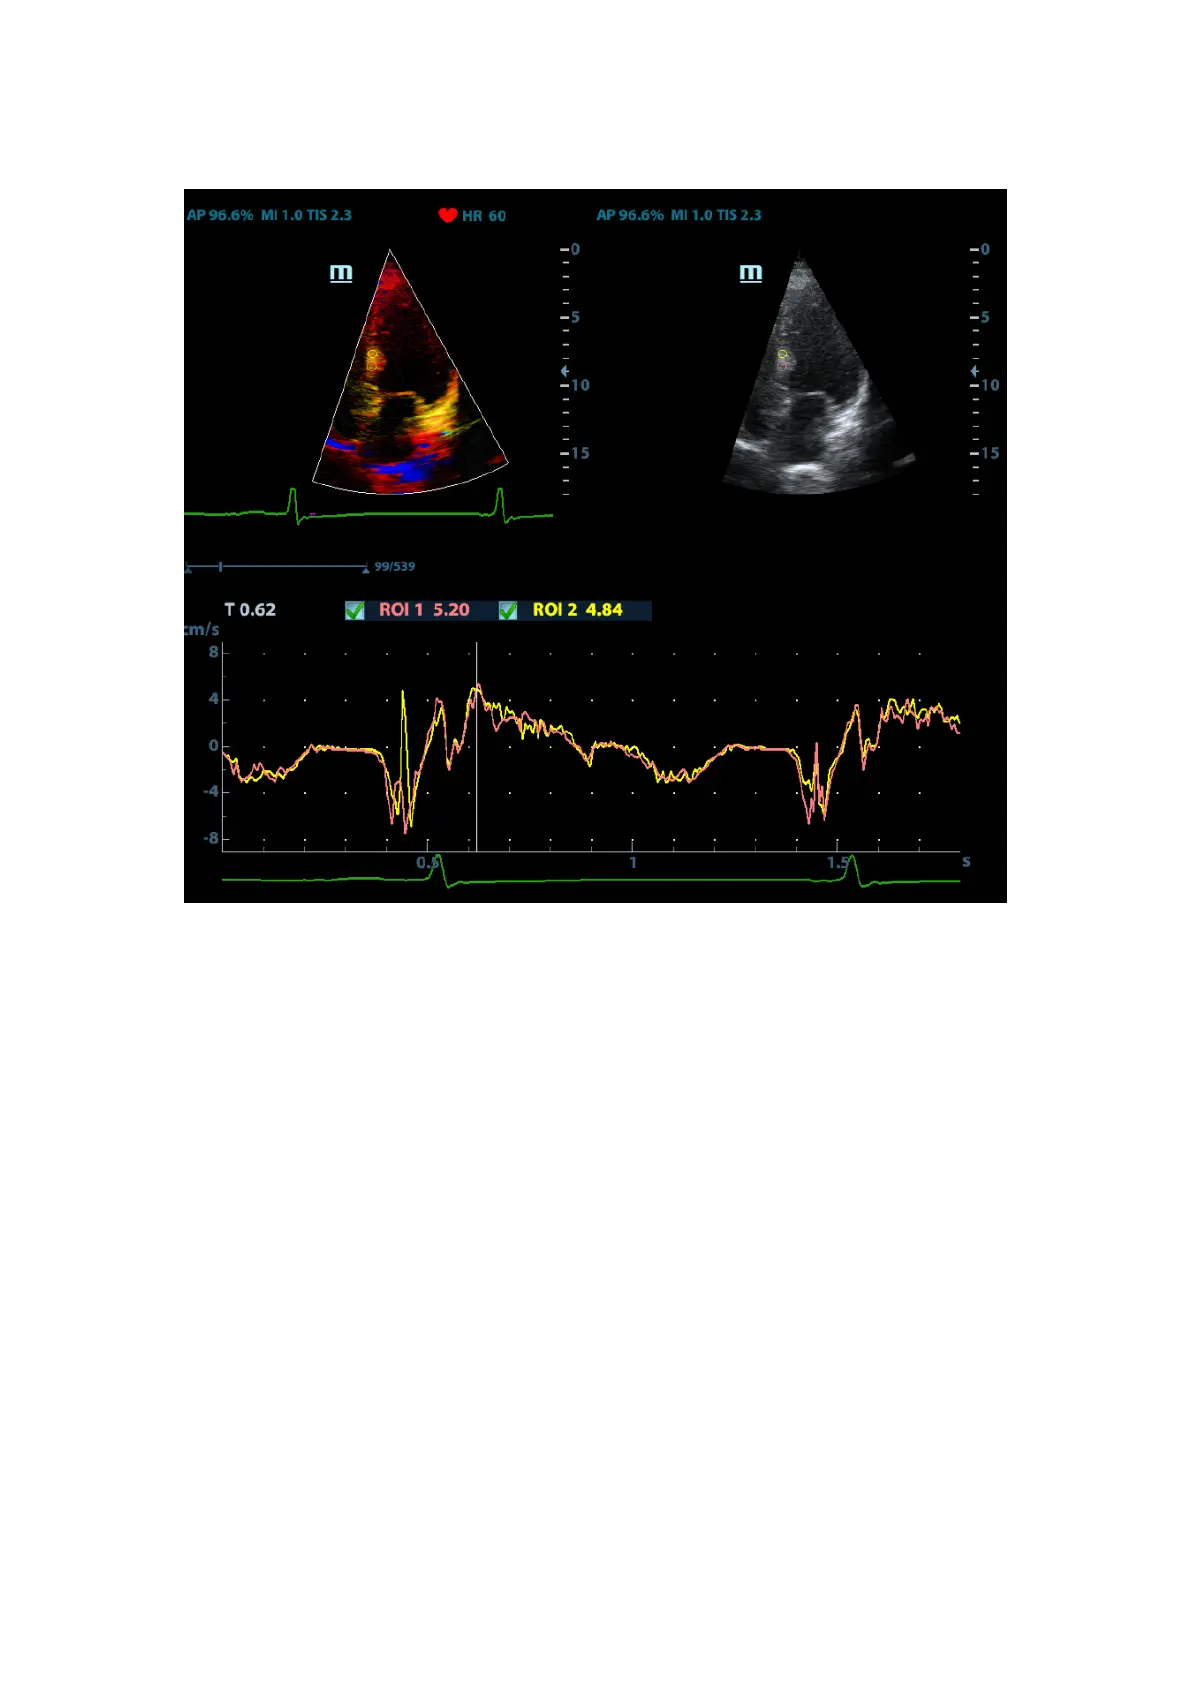
5.8.4.1 TDI QA Screen Description
1---TVI Cineloop window
Sample area: indicates sampling position of the analysis curve. The sample area is color-
coded, 8 (maximum) sample areas can be indicated.
2---B Cineloop window
Tips:
z Images in the TVI cineloop window and B cineloop window are the frozen image
of the same moment; roll the trackball to review the images in the two cineloop
windows.
z Sample areas are linked in the TVI cineloop window and B cineloop window.
3---Displays analysis curve
z Y axis represents the velocity (unit: cm/s), while X axis represents the time (unit:
s).
z Frame marker: a line that perpendicular to the X axis, can be moved horizontally
left to right (right to left) by rolling the trackball.
z Click the check box beside the ROI to set if to hide or to display the TIC curve.
4---Displays ECG trace.
1 2
3
4