18-3
18.3 Reviewing Tabular Trends
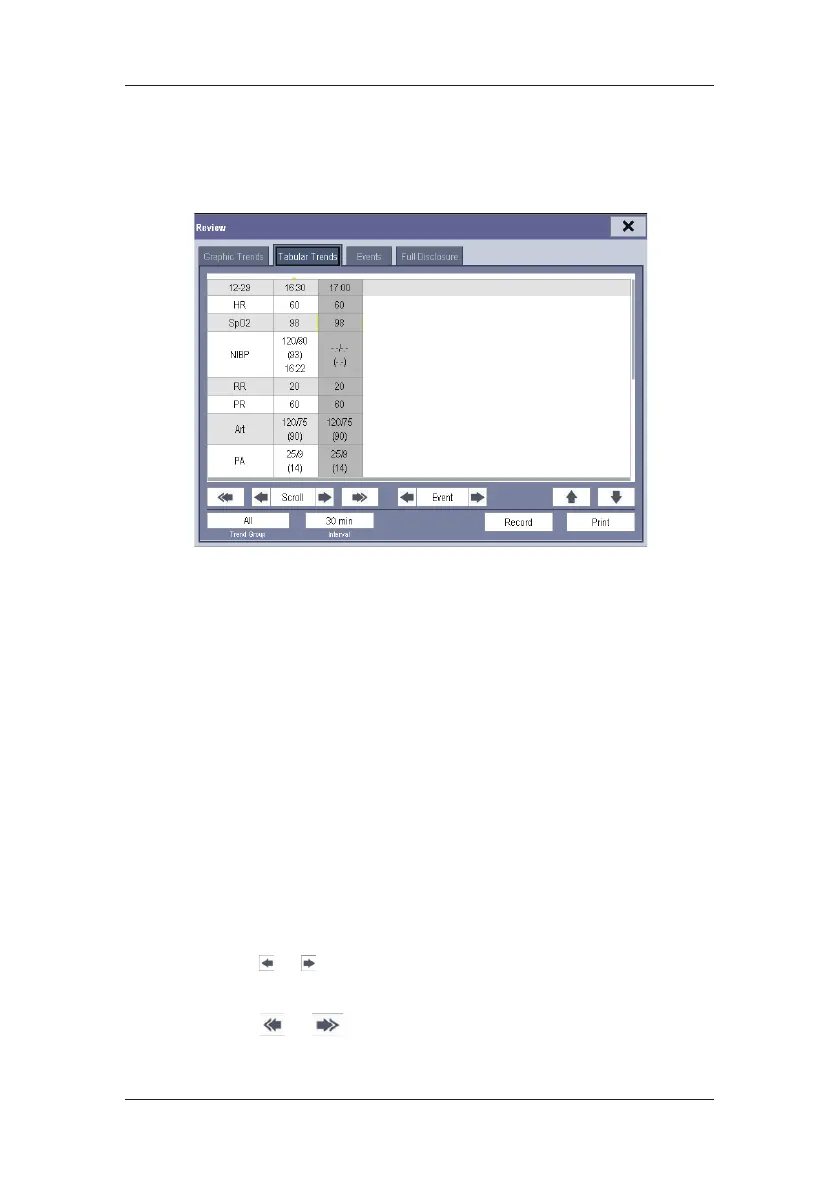
In the [Review] menu, select [Tabular Trends] to access the following window.
Events are marked with colors in window’s top area. Red represents high level alarm event.
Yellow represents medium/low level alarm event. Green represents manual event.
In this review window:
Select [Trend Group] and you can select a trend group for viewing in the popup menu.
If [Custom 1] or [Custom 2] is selected, you can further select [Define Trend Group].
Then you can select the parameters for viewing in the popup menu.
You can change the resolution of the trend data by selecting [Interval] and then
selecting the appropriate setting:
[5 s] or [30 s]: select to view up to 4 hours of tabular trends at 5- or 30-second
resolution.
[1 min], [5 min], [10 min], [15 min], [30 min], [1 h], [2 h] or [3 h]: select to view
up to 120 hours of tabular trends at your selected resolution.
[NIBP]: select to view the tabular trends when NIBP measurements were acquired.
To browse the tabular trends, you can either:
Select
or beside [Scroll] to drag the scrollbar left or right to navigate
through the trend database, or
Select
or to scroll left or right to navigate through the trend database.
 Loading...