6 Functions and settings
Maschinenfabrik Reinhausen 2014112 2374092/04 ENTAPCON® 260
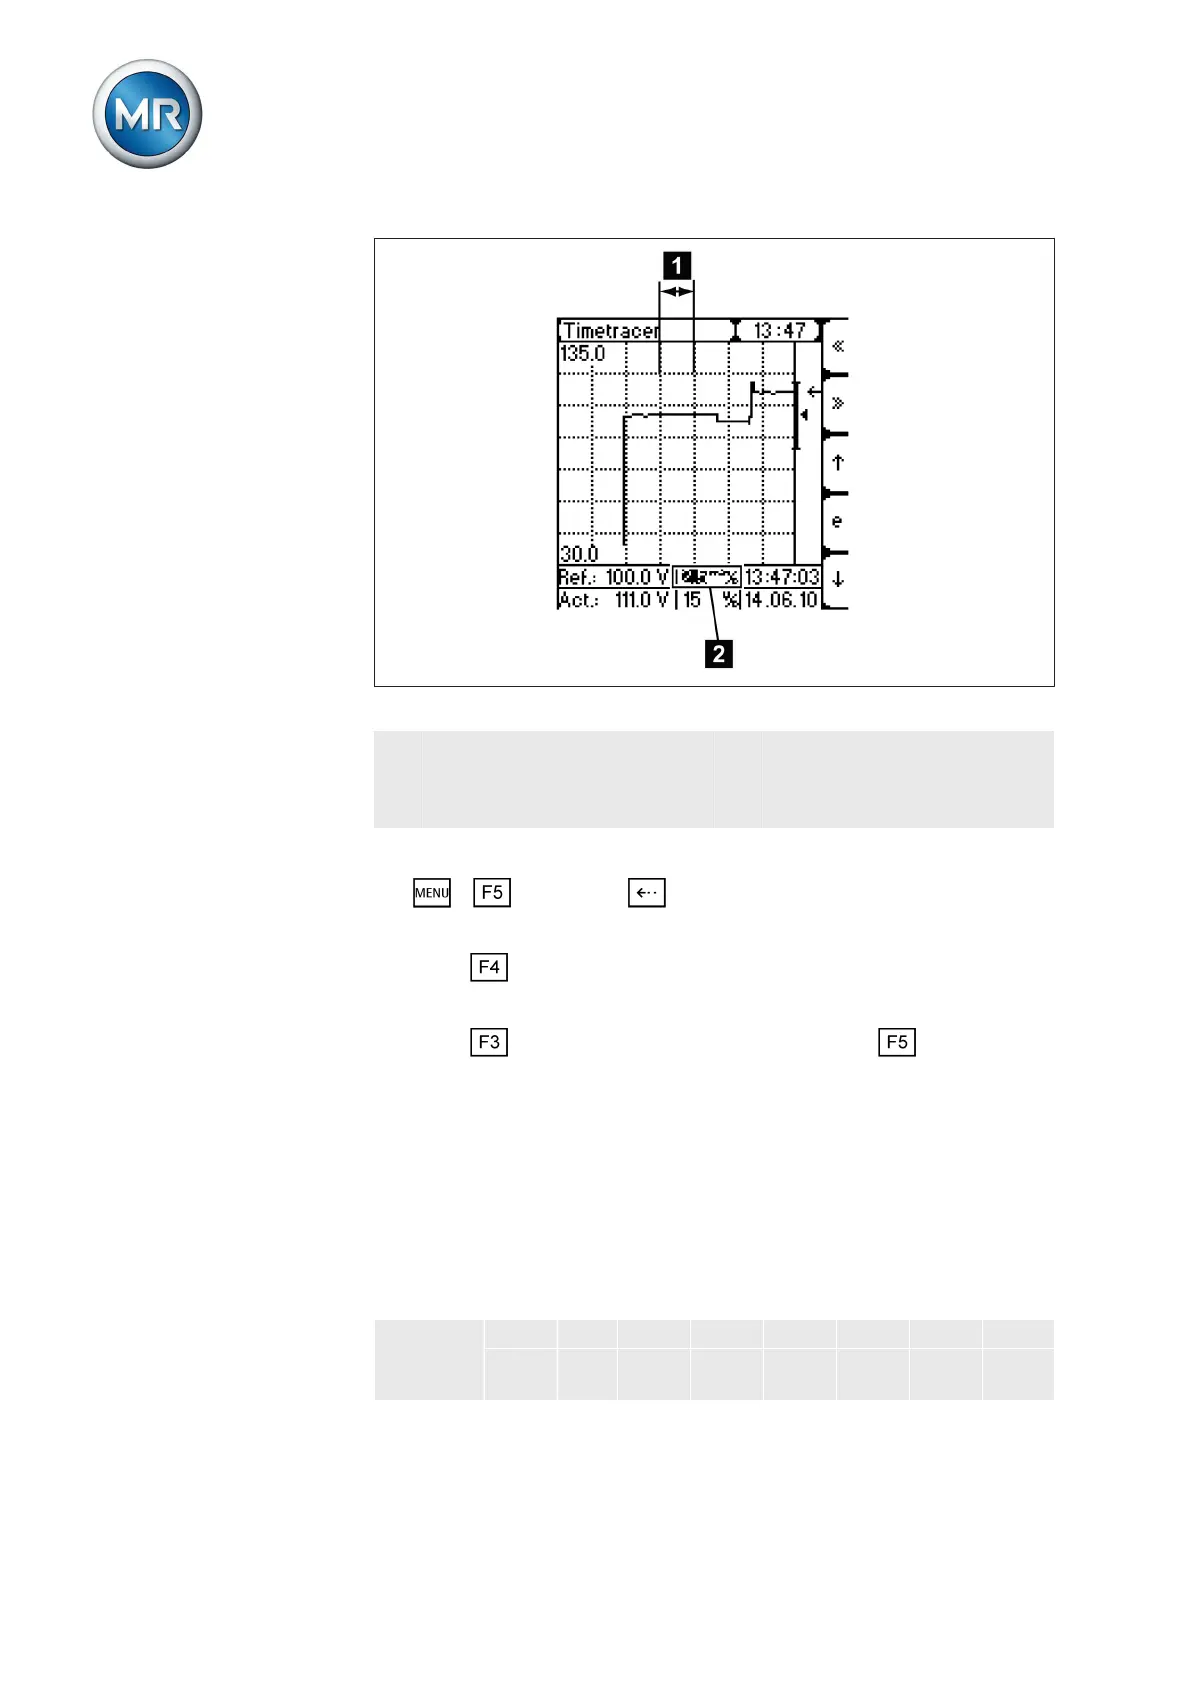
Figure 73: Time axis
1 Horizontal grid lines (the set
reporting time range is be-
tween the horizontal grid
lines)
2 Setting box for reporting times
displayed
To undertake settings, proceed as follows:
1. > Info > Press until the desired display appears.
ð Time plotter.
2. Press to highlight the setting box for reporting times.
ð The setting box is now highlighted and the value can be changed.
3. Press to move the display forwards one step or to move it
back one step.
ð The time axis is set.
Setting voltage range
In this display the voltage range is shown in the area between the horizontal
grid lines. You can restrict the area between the horizontal grid lines in the
corresponding setting box. Depending on the display setting, you can display
the voltage range to be displayed in V or kV. The voltage range to be dis-
played is divided as follows:
Division 0.5 V 1 V 2 V 5 V 10 V 15 V - -
0.1 k
V
0.2
kV
0.5 k
V
1 kV 2 kV 5 kV 10 k
V
20 k
V
Table 31: Voltage range between the horizontal grid lines
6.14.5.3