84
Cedex HiRes Analyzer Operator’s Guide
D
D
4.7 Measurement Statistics Histogram
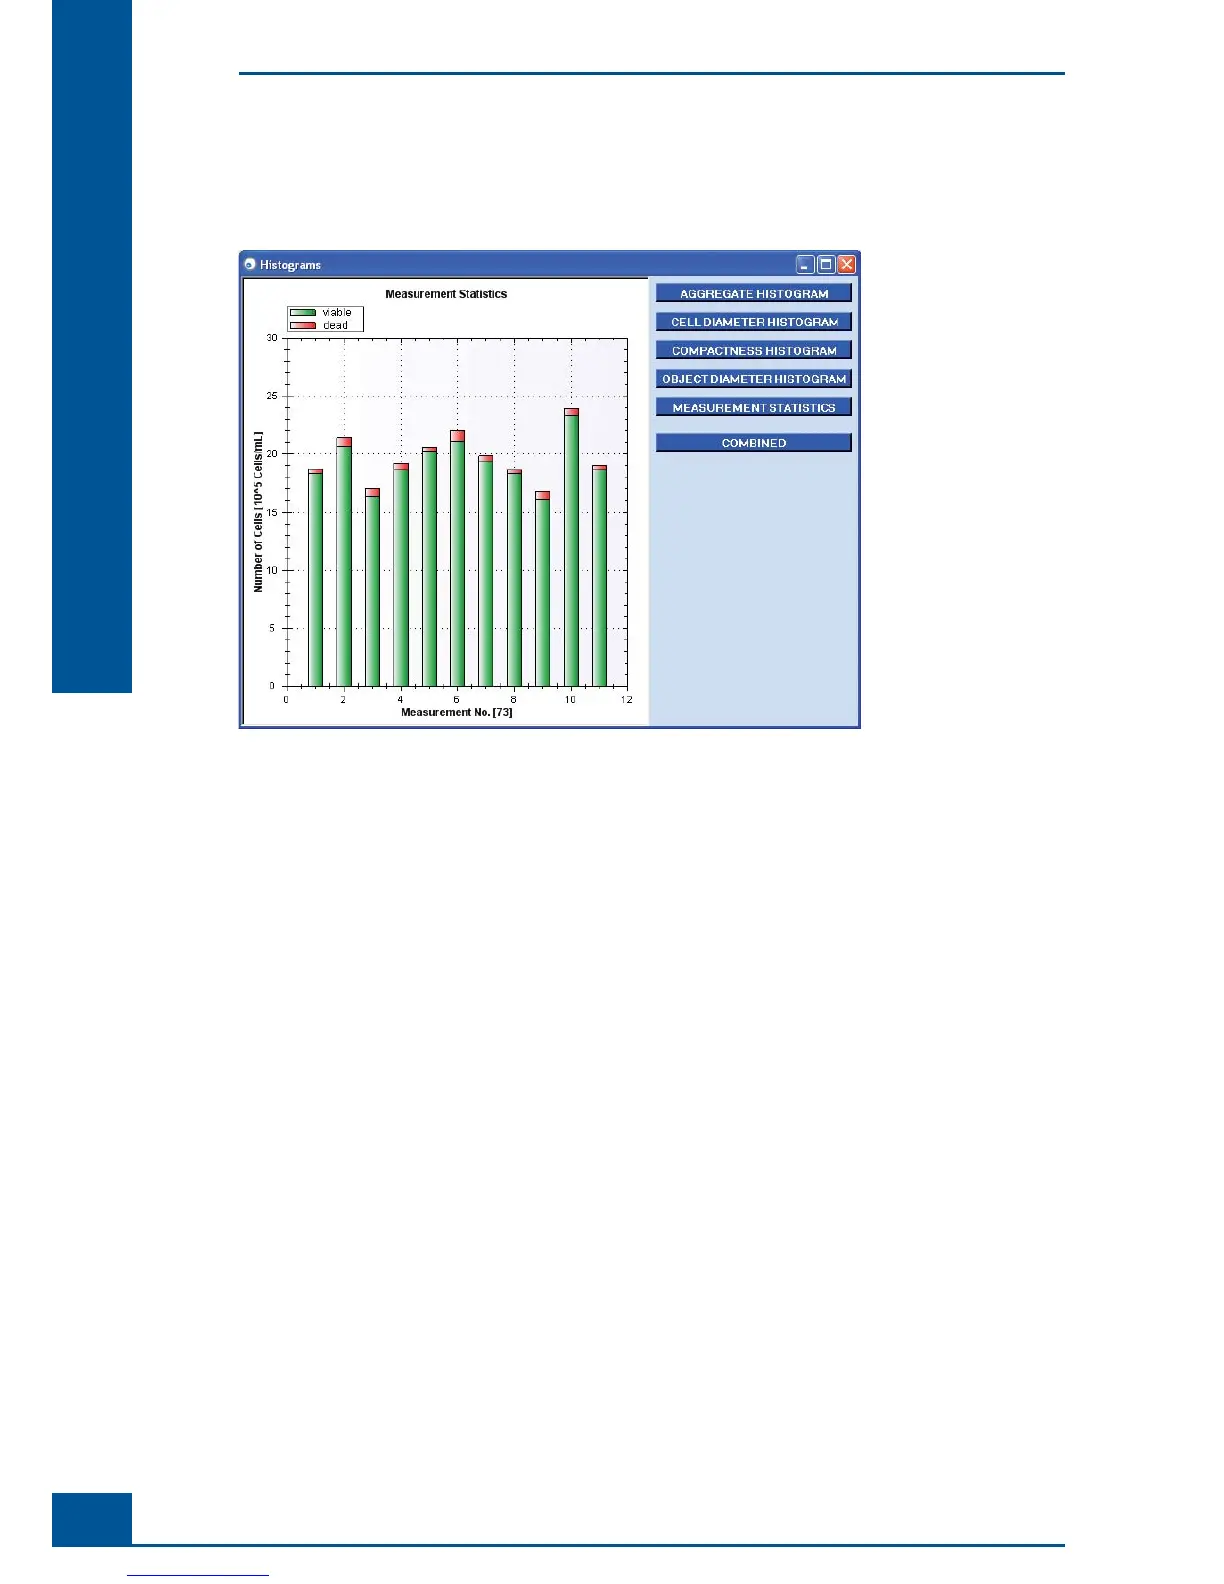
Click on the Measurement Statistics button to display a column diagram showing the total number of viable
cells (green columns) and dead cells (red columns) found in the images analyzed.
Figure 62: Measurement Statistics histogram
In the bar diagram, the number of living cells is represented in green bars and the number of dead cells in red
bars on top of the green bars. The Combine button, which appears when the Measurement Statistics histogram
is open, can be used to combine several images to give a better overview of the whole sample. Conspicuous
bars can thus be immediately identifi ed, and the user can then view and assess the relevant images (see “Image
Area”). The results of each individual image can be seen again by clicking on the Single button. If an image has
been automatically excluded by the software or manually excluded by the user, the corresponding position in
the diagram will be empty.
Graphical Display of the Analysis Results
Measurement Statistics Histogram