85
Software
D
D
5 Cultivation Time Chart
In the Cultivation Time Chart ( cultivation progress/ result diagram), the growth patterns of cell cultures can be
graphically evaluated. It is also possible to export and print out the data.
The CTC Views window required for creating a Cultivation Time Chart can be opened by clicking on the CTC
button in the Shortcuts area of the Cedex Control Center or by selecting the Cultivation Time Chart option
in the Measurements menu. In the CTC Views window, charts can be created, viewed, edited, exported and
deleted.
A collection of data used for the creation of a particular chart is called a View. Each View can have up to 5
separate series of measurements for comparison of data.
5.1 Creating a CTC View
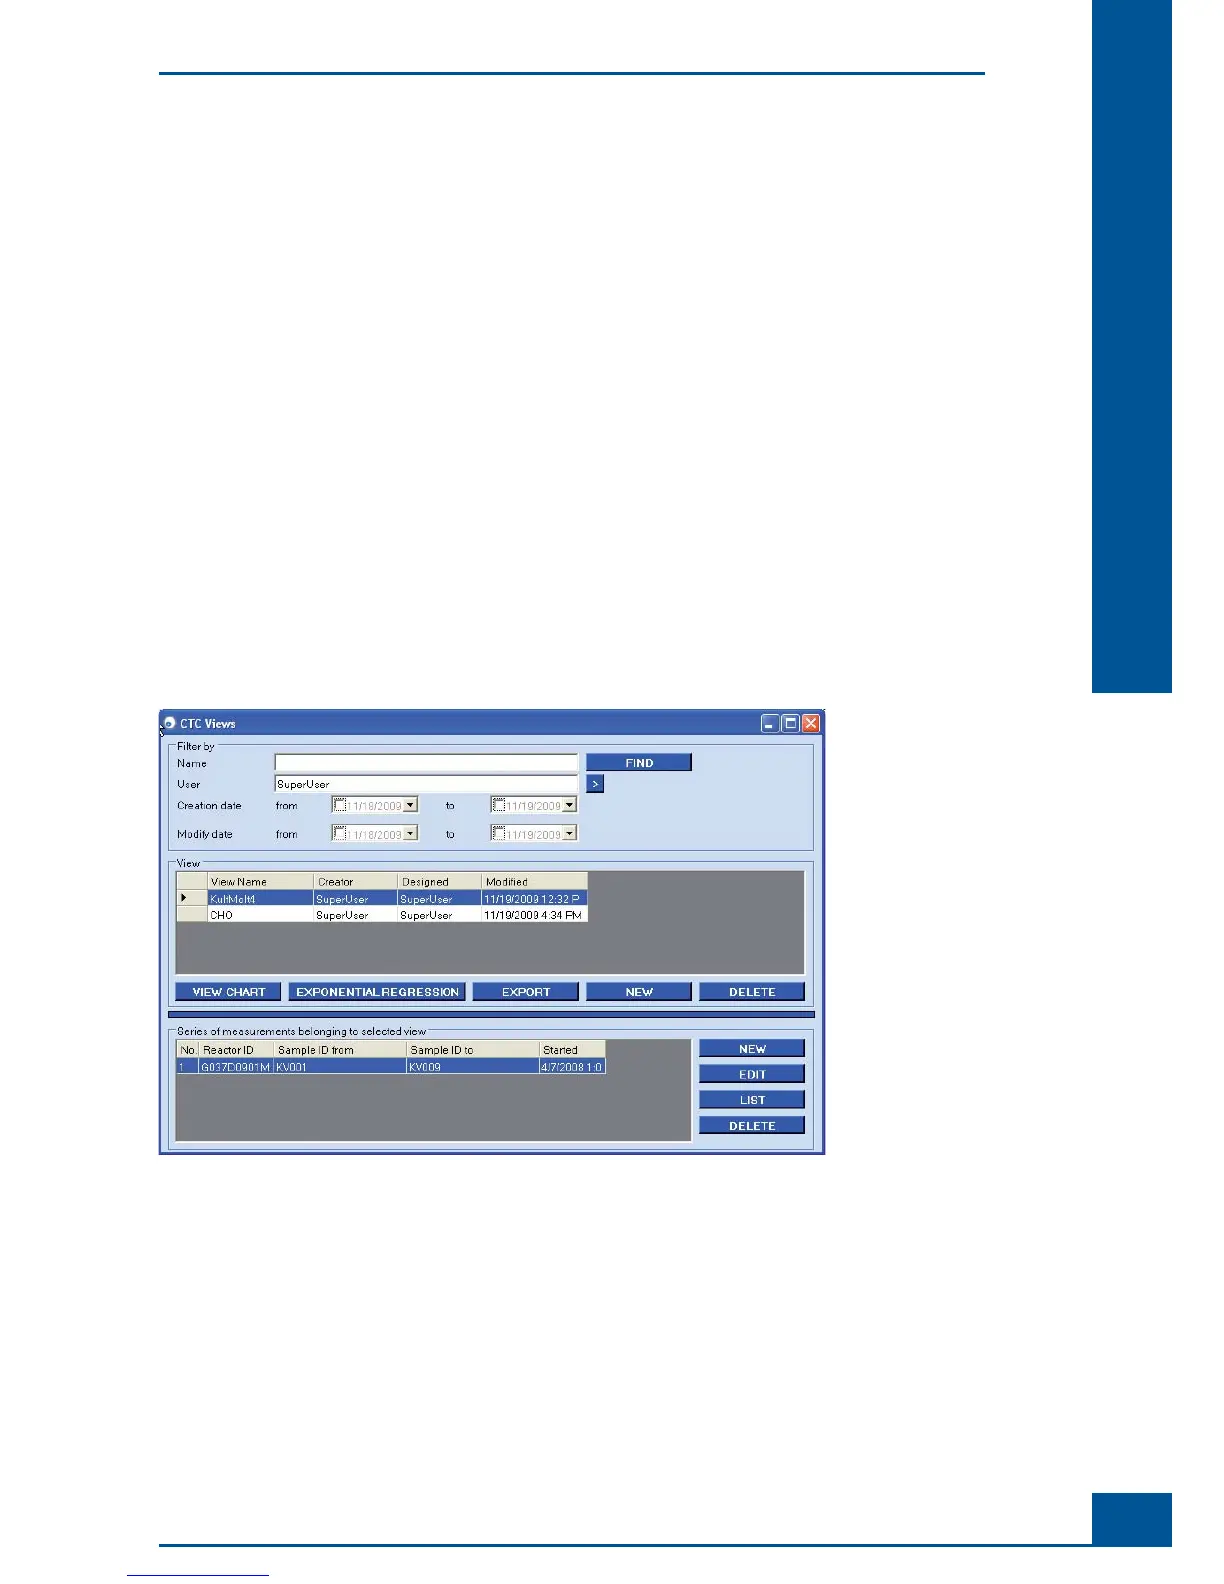
The CTC Views window has two areas (see Figure 63):
The View area is used for viewing, exporting, creating and deleting charts. The Filter By section located at
the top of this area is used for fi nding previously created cultivation time charts.
The Series belonging to selected view area is used for creating, editing, listing or deleting the various
measurement series belonging to the View highlighted in the View area.
Figure 63: CTC Views window
Cultivation Time Chart
Creating a CTC View