Mounting
32 © SICK AG • Subject to change without notice • 8024484/2019-06-06
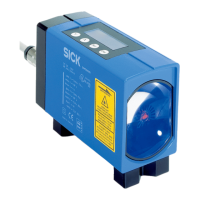
6.6 Aligningthedistancemeasuringdeviceandreectorto each other
1. Bringthedistancemeasuringdeviceandreectorclosetogether.
2. Align the distance measuring device so that the light spot of the sensor
hitsthecenterofthereector.
3. Increase the distance between the distance measuring device and
reector.Thelightspotofthesensormustcontinuetohitthecenterof
thereector.
4. Check the attenuation. The value for the attenuation must not exceed
the value in the table.
Attenuation value Thetablebelowspeciesthesignalattenuationvaluesinrelationtothe
distancebetweenthedistancemeasuringdeviceandthereector.The
values in the “Typical signal attenuation” column represent the expected
values when the measuring path and the distance measuring device are
in perfect working order. If the signal attenuation value exceeds the value
in the “Maximum signal attenuation” column, check the condition of the
measuring path.
The distance measuring device issues a level warning if the signal attenu-
ation value reaches the critical value of approximately –96 dB. If the signal
attenuation value then continues to rise, a level and plausibility error are
output, along with the measured value “0”.
Distance
[m]
Typical signal
attenuation [dB]
Maximum signal
attenuation [dB]
10 –32 –37
20 –44 –49
35 –54 –59
60 –63 –68
100 –72 –77
130 –76 –81
200 –84 –89
220 –85 –90
300 –91 –96
Table 6: Attenuation values
 Loading...

