Operating the measuring device
44 © SICK AG • Subject to change without notice • 8024484/2019-06-06
8.5 Parameter description
8.5.1 Main menu
The measured value is shown in the display by default.
With the
pushbutton you can switch from the measured value display
to the bar graph level display. You can scroll within the main menu using
the and pushbuttons.
Press the
pushbutton for at least 2 seconds to switch to the menu.
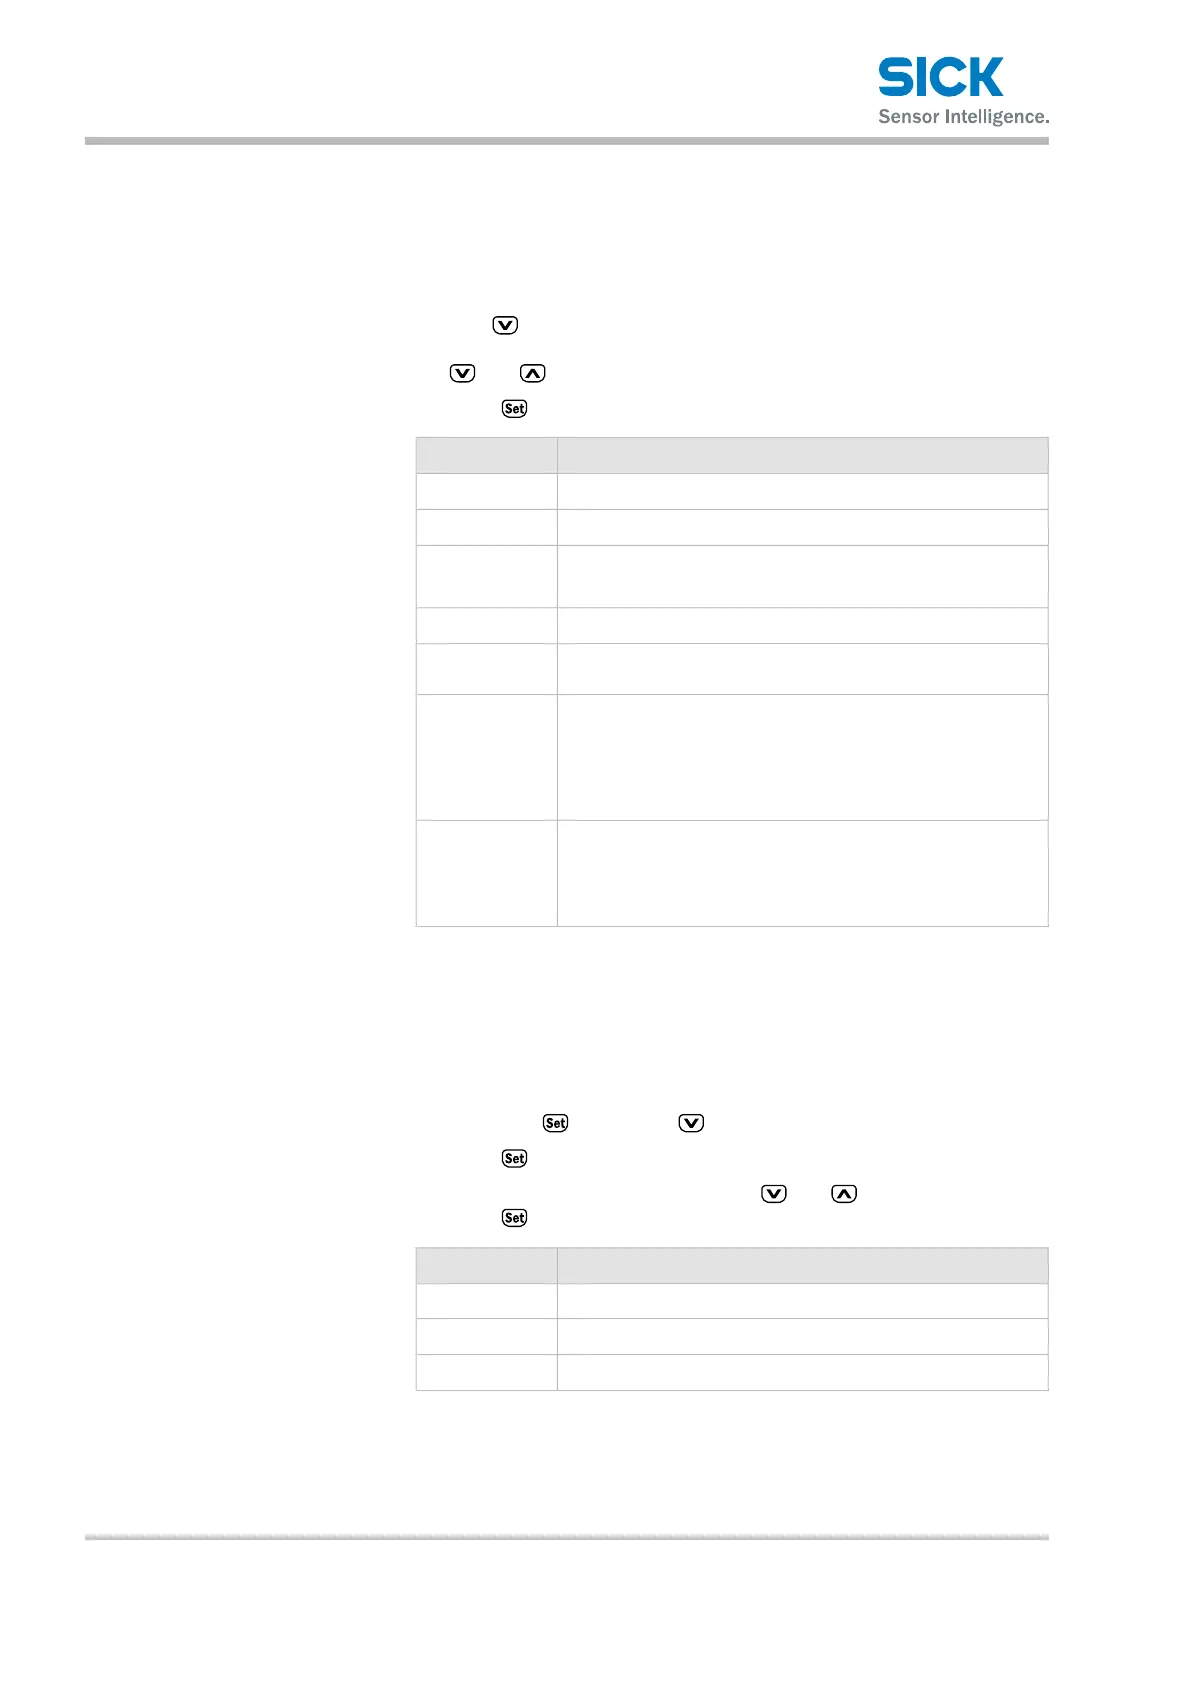
Display Description
Measured value Display of measured value in mm
Bar graph level Displays the level (attenuation value) as a bar graph
Numerical level Displays the level (attenuation value) as a numeric value
→ See also Page 32, Table 6.
Temperature Displays the internal temperature of the measuring device
Operating hour
counter
Displays the operating hours
Warnings Displays the pending warnings. If there is a warning pending,
the PWRLEDashingorange.Iftherearenowarningspend-
ing, no warnings are displayed.
→ See also Page 113, Chapter 13.2, list of possible
warnings.
Fault Displays the pending warnings. If there is an error pending, the
PWRLEDbeginsashingred.Iftherearenoerrorspending,
no errors are displayed.
→ See also Page 113, Chapter 13.3, list of possible errors.
Table 10: Main menu
8.5.2 “SwVers” menu
The “SwVers” menu displays all information relating to the software.
The “SwVers” menu is accessed via the following menu path:
Main menu →
→ Menu → → SwVers
Press the
pushbutton to display the “App-uC” parameter.
You can scroll within the menu using the
and pushbuttons.
Press the pushbutton to display the relevant parameter value.
Parameters Description
App-uC Displays the version of the application processor
FPGA Displaystheversionoftheeldprogrammablegatearray
Com-uC Displays the version of the communication processor
Table 11: “SwVers” menu