PVA-3000 Reference Manual
December 2, 2019 Sifos Technologies
from 0 dB with colorization to
indicate performance level.
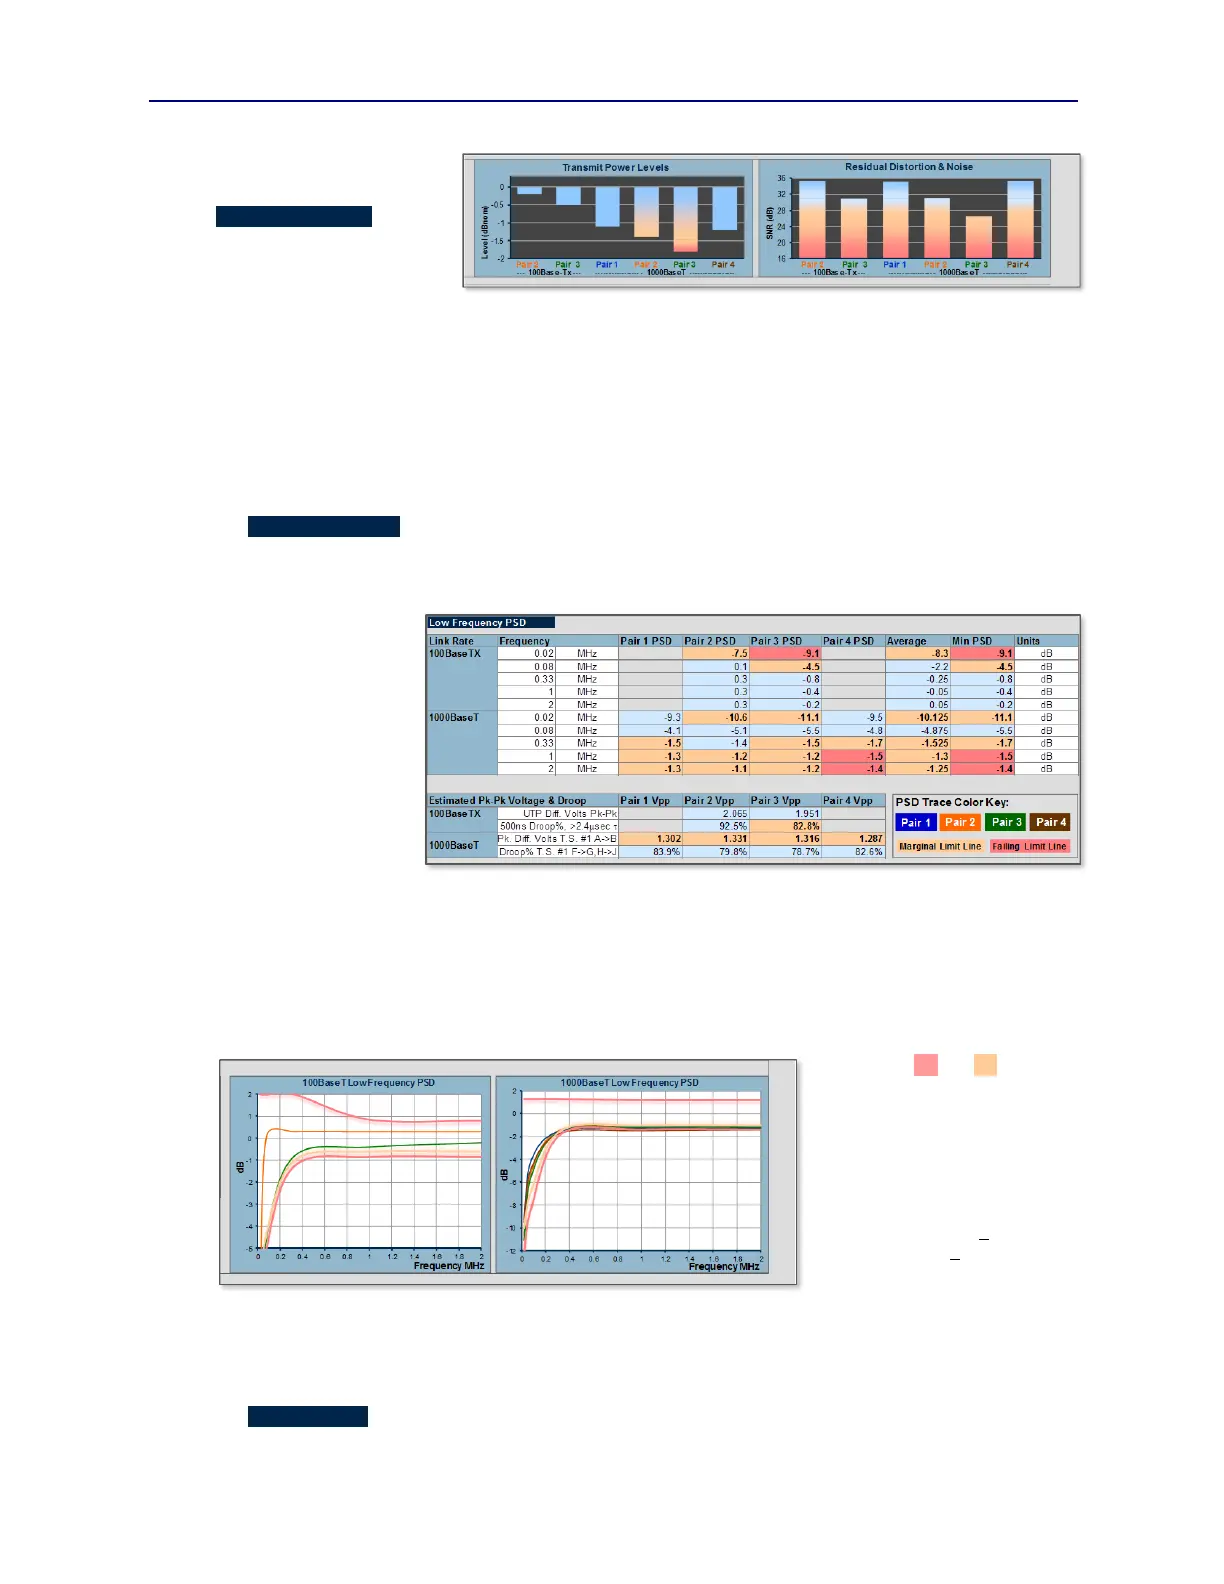
Signal Quality (SNR) is the
direct result of SNR
measurements (see Sections
1.3.4 and 2.2.2). Again these
measurements are available for
100BaseTx and 1000BaseT
(see Figure 5.4). The ideal result for SNR (or residual distortion) is the meter ceiling of 36 dB.
The test limits for SNR do not tie closely to any particular 802.3 specification and are therefore difficult to formulate
on a theoretical basis. Therefore, a large base of practical testing experience with many DUT’s is utilized as the
foundation for SNR limit checking at 100BaseTx and 1000BaseT. Expectations are that SNR should be above ≈31 dB
while below ≈27 dB will be flagged as a probable defect.
Similar to Transmit Power Levels, SNR is reported graphically using bar graphs as shown in Figure 5.5.
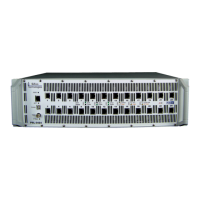
The Low Frequency PSD section of the report includes five PSD measurement points captured from the pva_tx_100
and pva_tx_1000 tests. These points span 20KHz to 2 MHz (see Figure 5.6). Tabular results include pairs 2 and 3 for
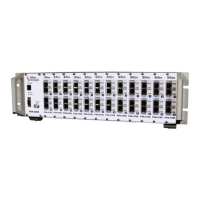
100BaseTx and pairs 1-4 for 1000BaseT. PSD (power) versus frequency plots are presented also using this tabular data
(see Figure 5.7). In these plots, one for 100BaseTx and one for 1000BaseT, each pair is color coded according to the
TIA/EIA convention
described earlier in
Section 1.3.10.
As described earlier in
Section 1.3.3, Low
Frequency PSD provides
fault coverage in areas
such as peak-peak signal
amplitude and pulse
droop. The Estimated
Peak-Peak Voltage and
Droop% tables are
produced using
relationships between
PSD, peak-to-peak voltage, and pulse droop that were established and verified during formal correlation exercises. The
Vpp and Droop% values in this table directly relate to 802.3 published specifications for 100BaseTx and 1000BaseT.
(Note: Droop is expressed as % of peak voltage @ 500nsec.)
PSD performance in the 20KHz and 80KHz bands will track with pulse droop that is a consequence of isolation
transformers (magnetics) utilized in physical layer interfaces.
Two-tiered (red and tan) test limits
for Low Frequency PSD are
plotted in each PSD graph (see
dotted lines in Figure 5.7) so that
limit excursions are easily
observed. Limits for PSD in the 1
– 2MHz region are very much tied
to peak-to-peak amplitude
allowances, namely ~+ 0.44 dB for
100BaseTx and ~+0.85 dB for
1000BaseT. These are extended
slightly to allow for PVA
measurement tolerances. Limits
for 20KHz and 80KHz PSD are theoretically estimated based on 802.3 droop specifications in 100BaseTx and
1000BaseT. All limits have been influenced by extensive practical data collection and formal correlation studies
performed by Sifos and outside third parties.
The Wide Band PSD section of the report includes six PSD measurement points captured from the pva_tx_100 and
pva_tx_1000 tests. These points span 4MHz to 100MHz for 100BaseTx and 4MHz to 88MHz for 1000BaseT (see
Figure 5.8). Tabular results include pairs 2 and 3 for 100BaseTx and pairs 1-4 for 1000BaseT. PSD (power) versus
Figure 5.5 Transmit Power & SNR Graphics
Figure 5.6 Low Frequency PSD Tabular Results
Figure 5.7 Low Frequency PSD Graphical Representation