WEB Interface 111
ID: um_t2gateway CP560 DVB-T2 Gateway User’s Manual Rev. 2.2 (3686)
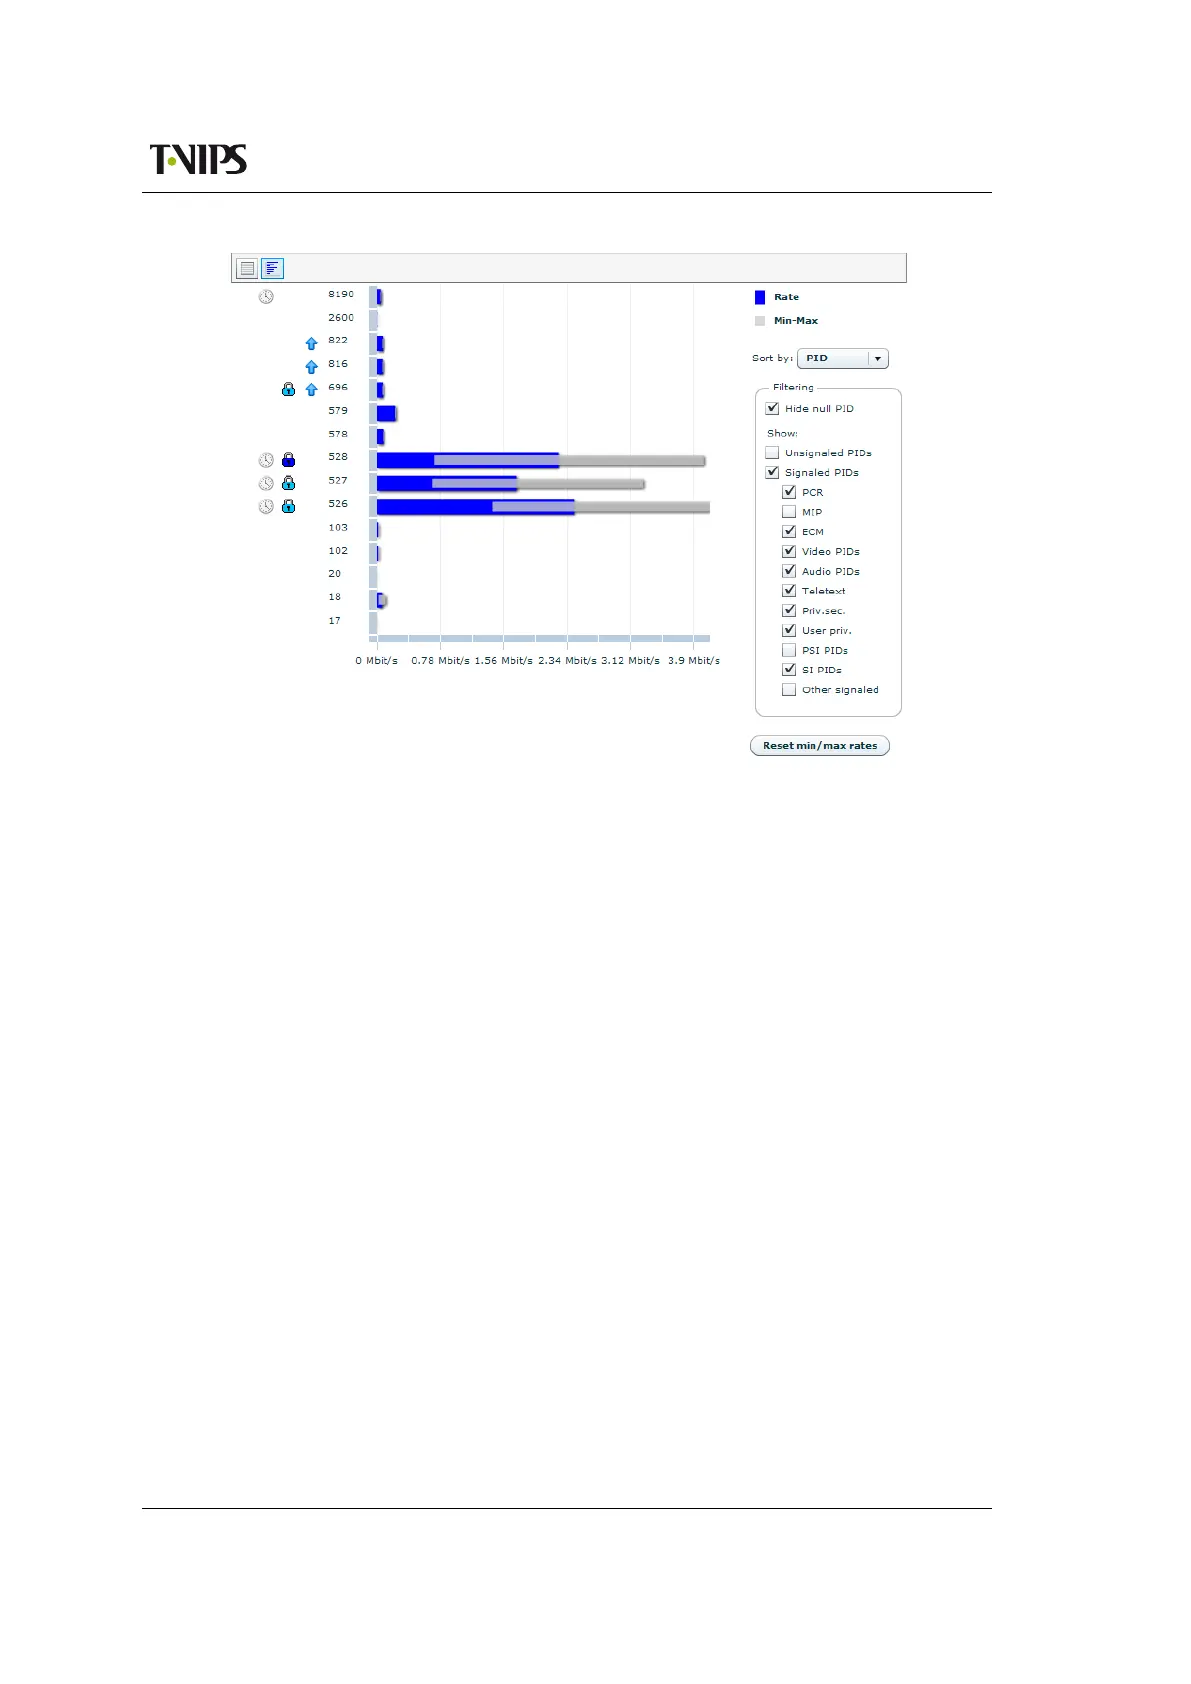
Figure 8.60 PID Details, rate view
Vertically, the chart displays one bar for each of the packet streams present on the input. Adjacent
to the PIDs the symbols shown in figure 8.59 are shown if relevant.
Horisontally, the bar chart shows the current rate and the minimum and maximum rates mea-
sured for each packet stream. The blue bar shows the current rate. The grey bar shows minimum
and maximum rates. Holding the mouse cursor over a bar shows a tool tip with the rates as a
numeric value.
To the right of the chart a field of options are provided to configure the view. The Sort by drop
down menu on top lets the user sort the bar chart by different parameters. The Filtering frame
lets the user choose which PIDs to show. Checking the Hide null PID check box removes the
null PID from the chart. Unchecking any of the other check boxes removes the corresponding
PIDs from the chart.
Below the Filtering frame the Reset min/max bitrates button is provided. Hitting this button
resets the min and max rates counters of all PIDs.
8.5.2.6 Tables
The Tables page shows detailed information about all the tables that are currently residing in
the input SI/PSIP database of the device. Accessing the related sub pages gives access to table
contents right down to byte level.
Which tables being currently analysed by the device is also displayed.
“Tables” tab
The button switches to a detailed view of the tables present on the input and analysed by
the device.