Creating and Using Math Waveforms
3- 158
TDS5000 Series User Manual
waveform reference marker. This moves the waveform without changing the
Reference Level control setting. Sometimes it is beneficial to adjust this control
so that the peak of a fundamental is at zero dB. Then you can measure other
harmonics in terms of how many dB they are away from the fundamental. Click
the dBm button to preset this level to the equivalent of 1 mW into 50 ohms.
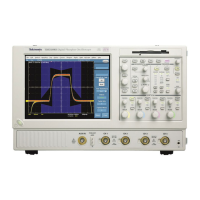
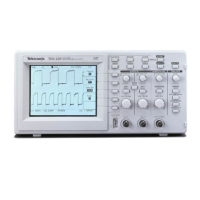
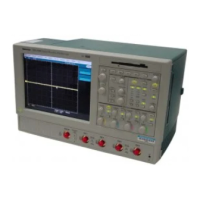
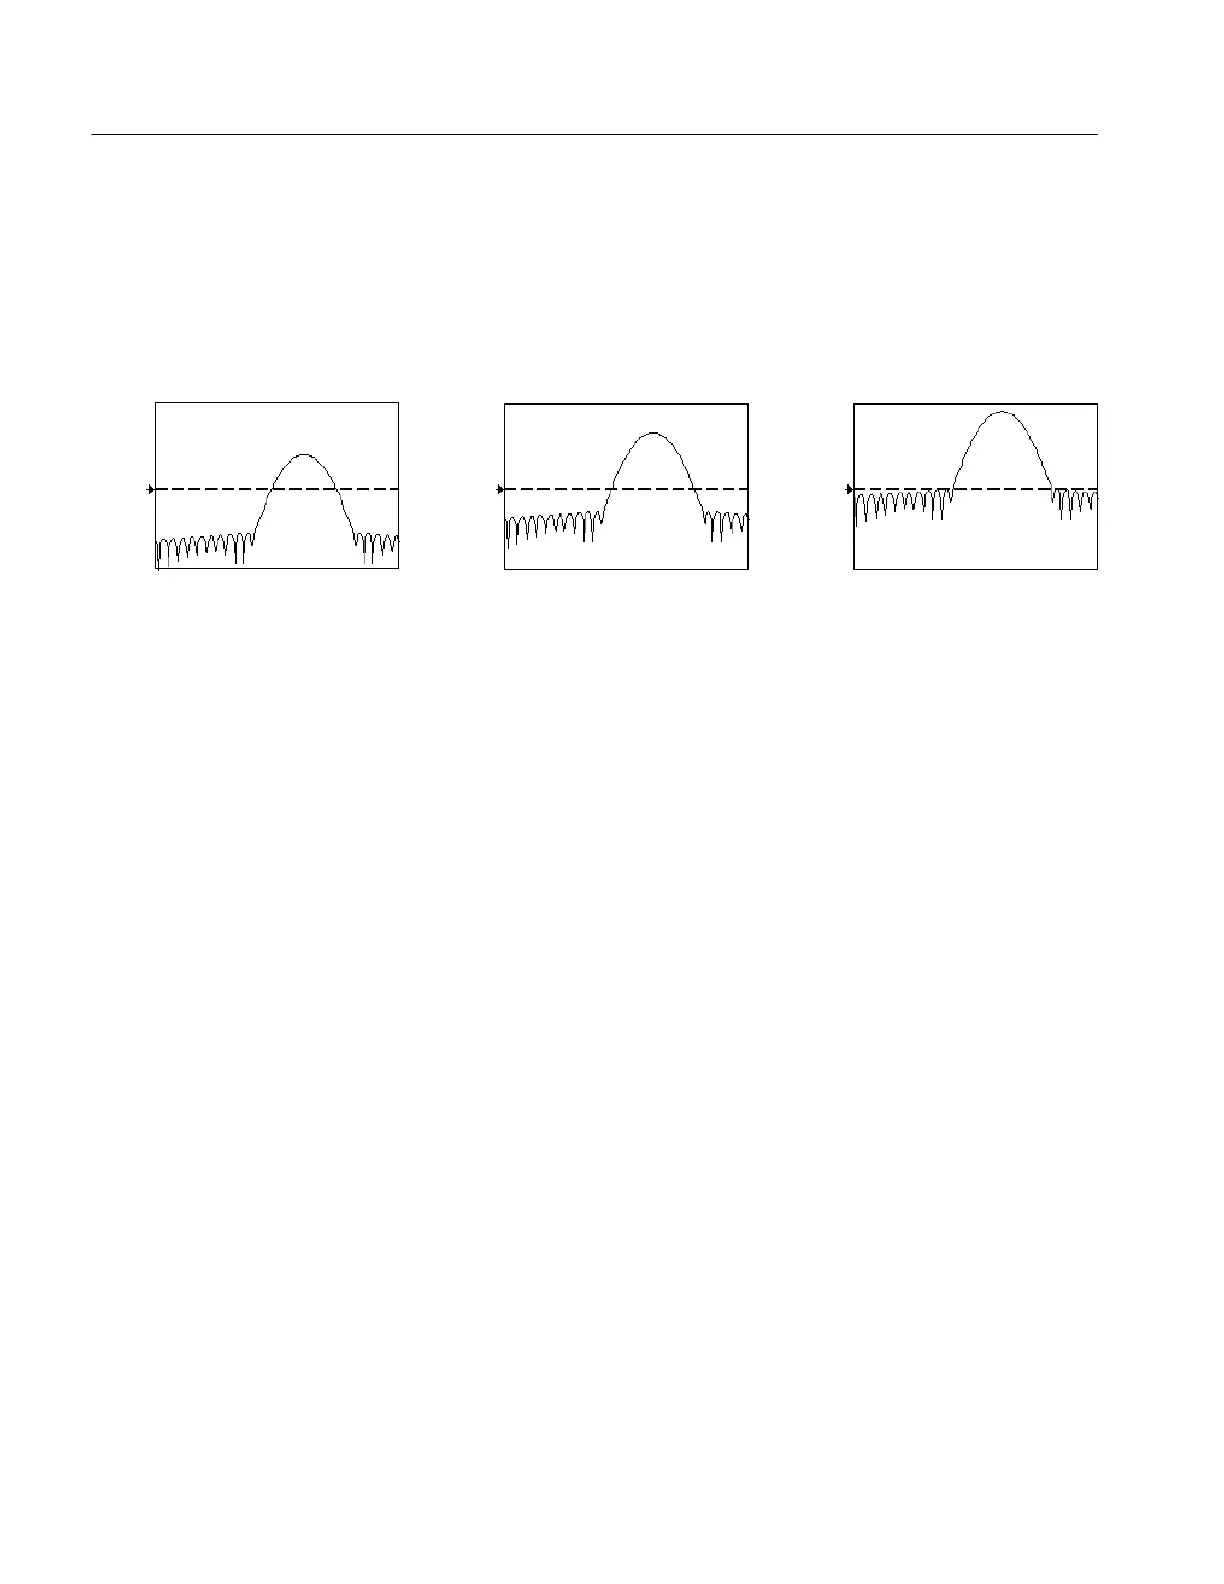
0dB
20 dB 20 dB 20 dB
Figure 3- 46: Effects of adjusting the reference level offset control
Real and Imaginary Magnitudes: You can display the linear magnitude of the
real data or the imaginary data in the spectrum. This is useful if you process the
spectrum off line and transform it back into a time domain trace. You can save
the real and the imaginary spectrum into reference memory, and export the
waveforms directly into Mathcad, MATLAB, or Excel documents to update in
real time.
To turn on a real or imaginary spectrum, click the Math menu button, select
Define/Edit Expression Editor, and select the Freq tab. Click either the Real or
the Imag buttons and enter an expression. C lick the appropriate channel button,
and click Apply.
Using the Phase Controls. You can set the vertical units to Degrees, Radians, or
Group Delay in seconds. To do this, click the Math toolbar button, click Spectral
Analysis Setup, and select the Phase tab. Then select the desired scale type from
Degrees, Radians, or Group Delay.
Phase Reference Position: Phase is a relative measurement that must have a time
domain reference point. The phase value is specified with respect to this phase
reference position.
For the spectral analyzer, the phase reference position is the 50% position of the
gate, that is, the middle of the gate interval of the data that is input to the spectral
analyzer. This is true for all window functions except for the Tek Exponential
window. This window has a the reference point at the 20% position of the gate.
Phase Unwrap: The spectral analyzer produces phase values from --π to
π radians or --180 to 180 degrees. However, when you perform impulse response
testing and the phase is continuous, then phase values outside these ranges may
occur. The spectral analyzer then wraps the data with discontinuities in the
 Loading...