Creating and Using Math Waveforms
3- 182
TDS5000 Series User Manual
Overview Control elements and resourcesTo define a spectral math waveform
Take cursor
measurements
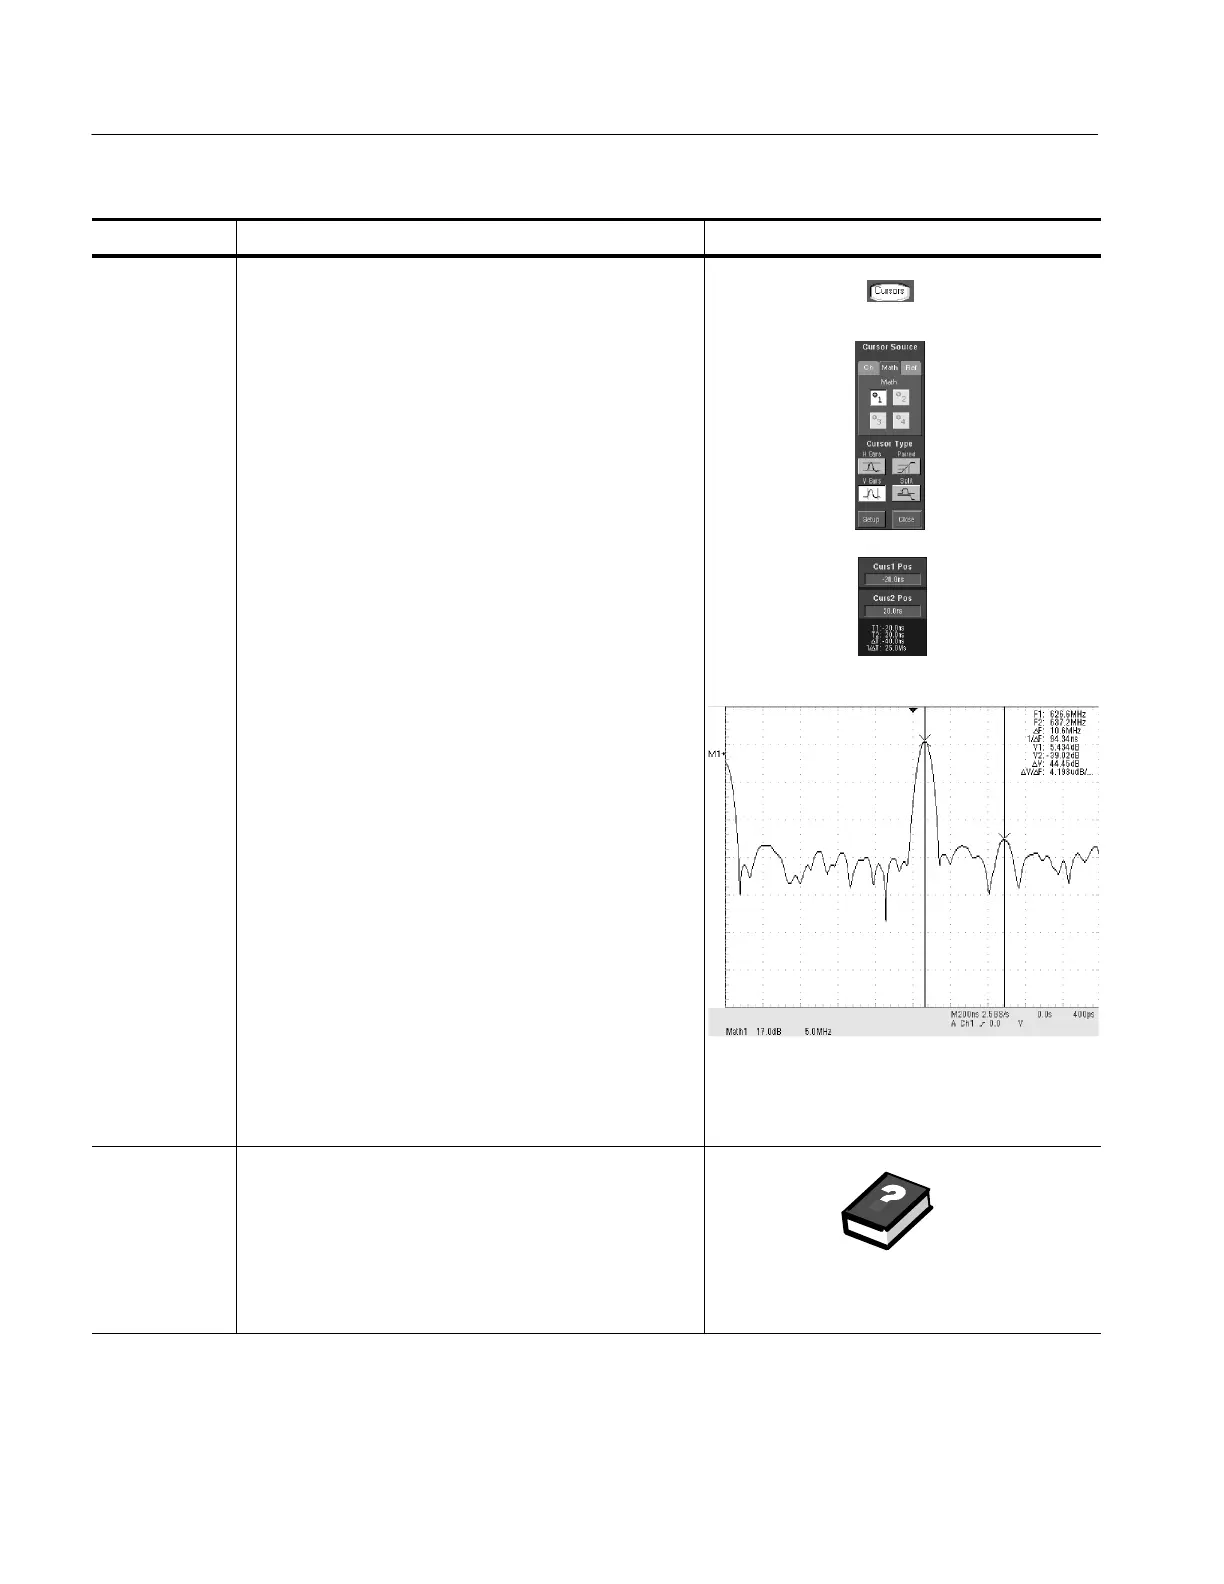
26. From the toolbar, click the Cursors button to display the
cursors and open the Cursor control window.
27. Select the Math tab and click the channel button for the
spectral waveform that you want to measure.
28. Select the cursor type. For more information, see Taking
Cursor M easurem ents starting on page 3--124).
29. Use the multipurpose knobs to position each cursor on
the waveform to measure the feature(s) that interests
you.
30. Read the results in the cursor readout.
The cursor readout is displayed under the multipurpose
readouts as shown here or in the upper right corner of
the graticule area.
The figure shows the cursor measurement of a
frequency magnitude on an FFT. The readout reads
0 dB because it is aligned with the 1 V
RMS
level. The
other readout reads 24.4 dB indicating the magnitude of
the frequency it is measuring is -- 24.4 dB relative to
1V
RMS
. Display of the source waveform is t urned off.
The cursor units will be in dB or volts for magnitude
waveforms and in degrees or radians for those
measuring phase.
31. Select V Bars and use the m ultipurpose knobs to align
the two vertical cursors to points of interest along the
horizontal axis of the waveform.
32. Read the frequency difference between the cursors from
the ∆: readout. Read the frequency of each cursor
relative to the zero frequency point from t he cursors
readout.
For further
assistance
33. Access the online help for more information about
creating spectral math waveforms.
See Accessing O nline Help on page 3--209 for an
overview of the online help system
 Loading...