Data Input and Output
TDS5000 Series User Manual
3- 201
Overview Control elements and resourcesTo use exported waveforms
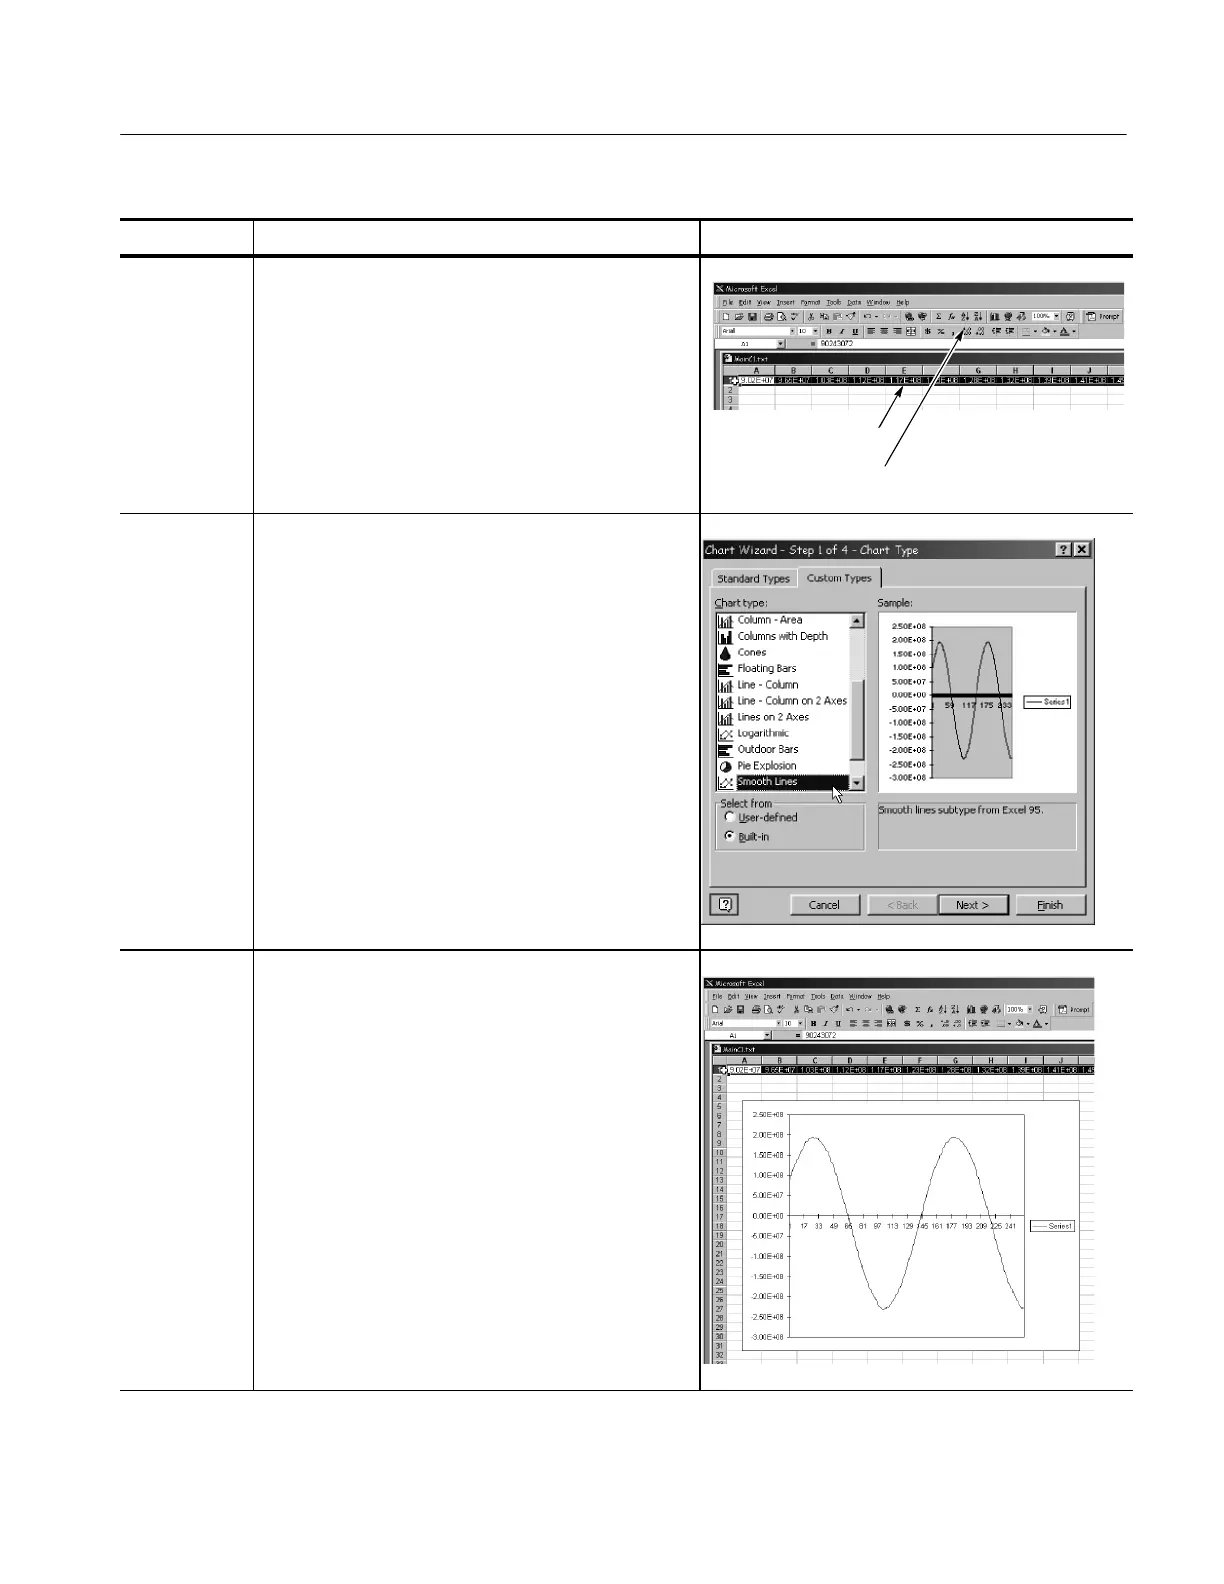
Begin your
chart
5. Click on the row number to select the entire row
containing your imported waveform values.
6. Select the Chart butt on from the toolbar or from the
Insert menu.
Access the Chart W izard
Select the entire row
Specify a
line-graph
chart
7. From the Ch
rt
iz
rd, m
ke sure Built In is
he
ked.
Then select either Lines in t he Standards Types tab or
Smooth lines in the Custom Types tab.
Finish the
chart
8. Click Next to step through t he next two steps
accepting the defaults setting at each step. Click the
Finish button in step 4. You should have a waveform
display similar to that show right.
Tip. This procedure assumes that you are using MS
Excel 97. You can likely specify tit les, customize the
treatment and labeling of the x and y axes, and so
forth in your data-analysis application—either as you
create the chart or aft erward. Use the help for your
data-analysis application to determine if it has these
capabilities and for instructions in using them.
 Loading...