CFM-BL10Pro General instruction manual
30 / 87
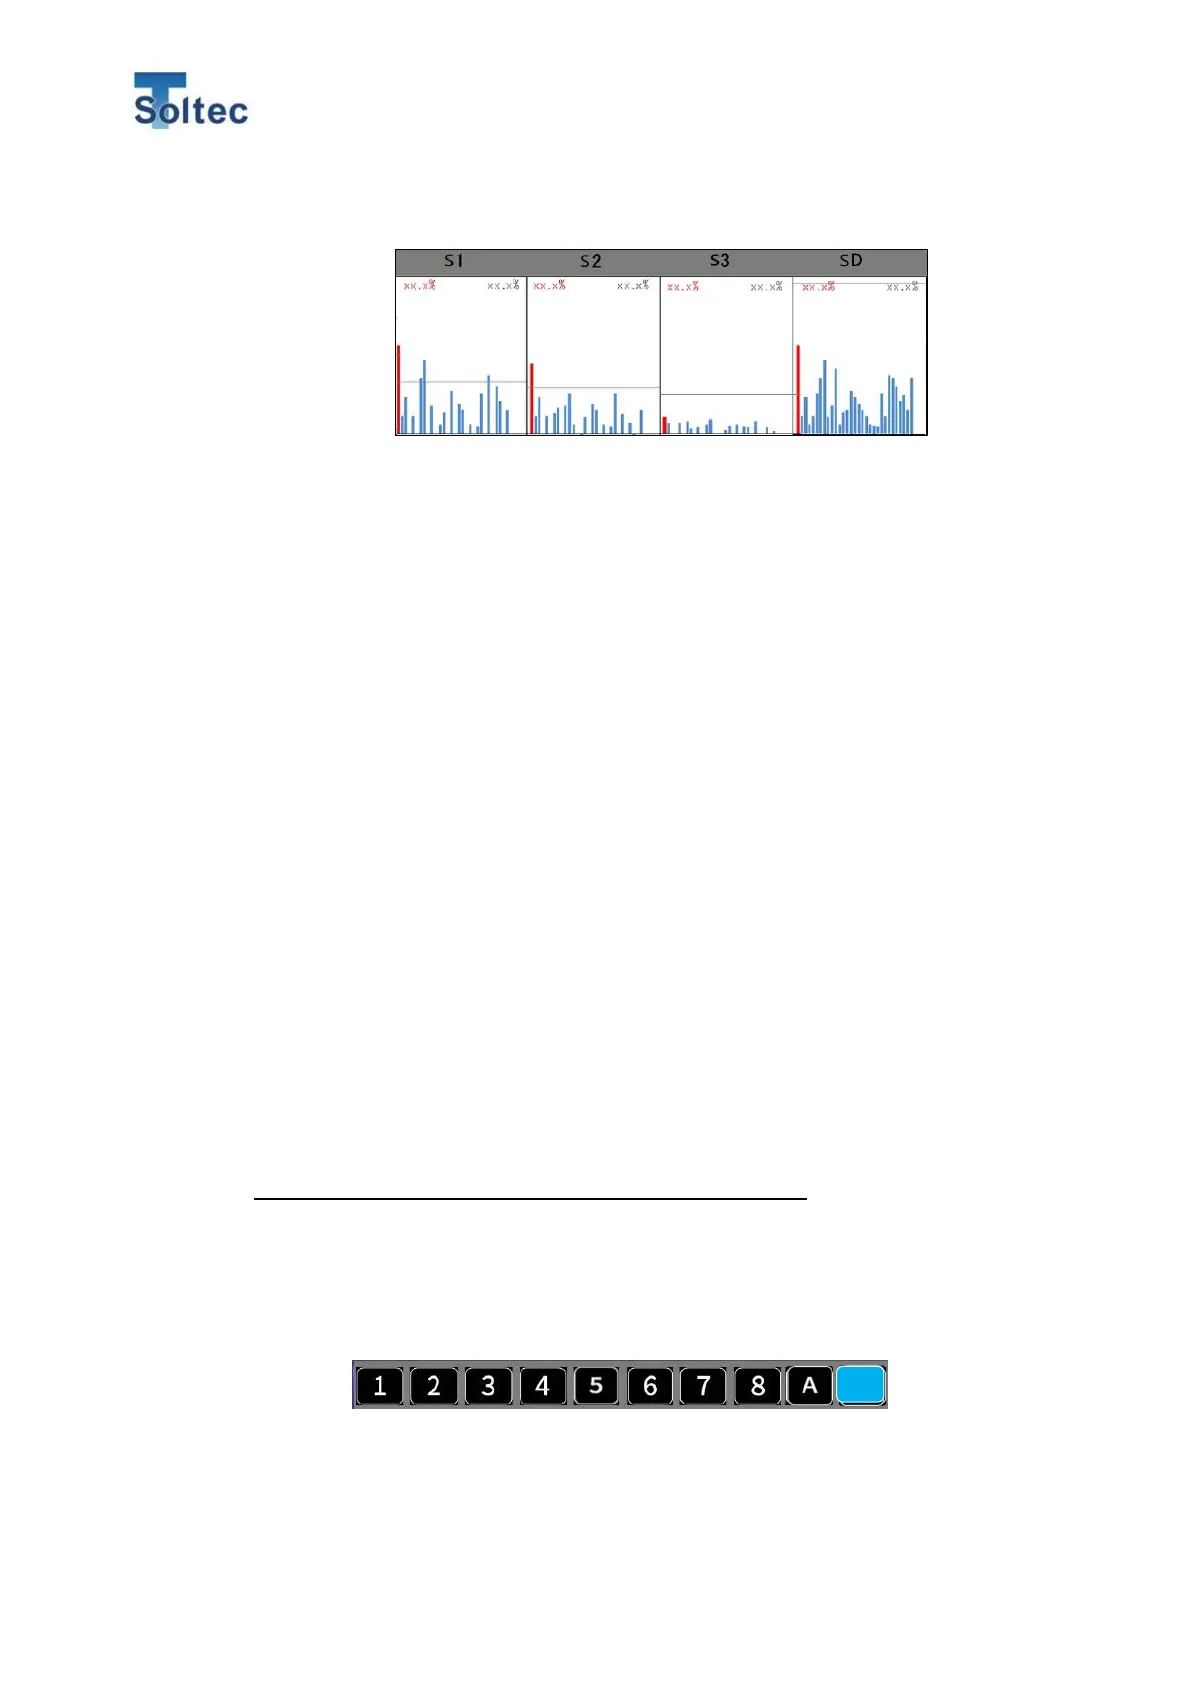
S1 ~ SD Transition graph
CFM shows the graph of the latest 30 samples for each area. Those graphs are
histories to help selecting appropriate tolerances. The tolerance lines are
displayed in gray, and you can see at a glance which tolerances we should select
for stable crimps (good samples are judged as good and defective samples as
defective.)
On the left edge of each area, the maximum measurement values after Teach is
displayed. Values in red on the upper left corner are the maximum. Values in red
on the lower left corner are the minimum. Values in gray on the upper right corner
are the maximum tolerance. Values in gray on the lower right corner are the
minimum tolerance. If the detection function of an area is disabled, “OFF” is
displayed in the graph area. These graphs are cleared every Teach.
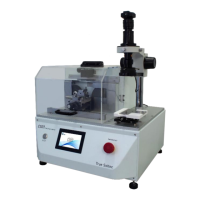
5.1.7. Tolerance setting
Tolerance numbers and the tolerance values of Tolerance “M” can be freely
changed.
However, even if tolerance number is used, the changed tolerance values are
saved as ”M” tolerance, not saved in each tolerance number.
*The values of tolerance number 1 to 8 cannot be changed.
Procedure for the tolerance change
1. In the tolerance select screen, press tolerance number or “M” button for more 3
seconds.
2. Up and down buttons are showed up on the right side of the graphs.
S tolerance transition graph is updated even when S tolerance is
enabled. The graph helps customer to check if S tolerance is
effective.