MAN MACHINE INTERFACE
PRS-7367 295
Figure 7.3-10 LCD Display Diagram of (a) BI Monitored Data (b) D-BI Monitored Data
7.3.4 Event Information
This section is divided into four sub-section and describe the information of all events, like fault
events, alarming information (warning records), selfchk info, SOE, remote control, user records
and power records etc. The LCD display event diagram of the IED is listed in below figure 7.3.11:
Figure 7.3-11 Overview Display of Event Information Sub-functions
7.3.4.1 Port Records
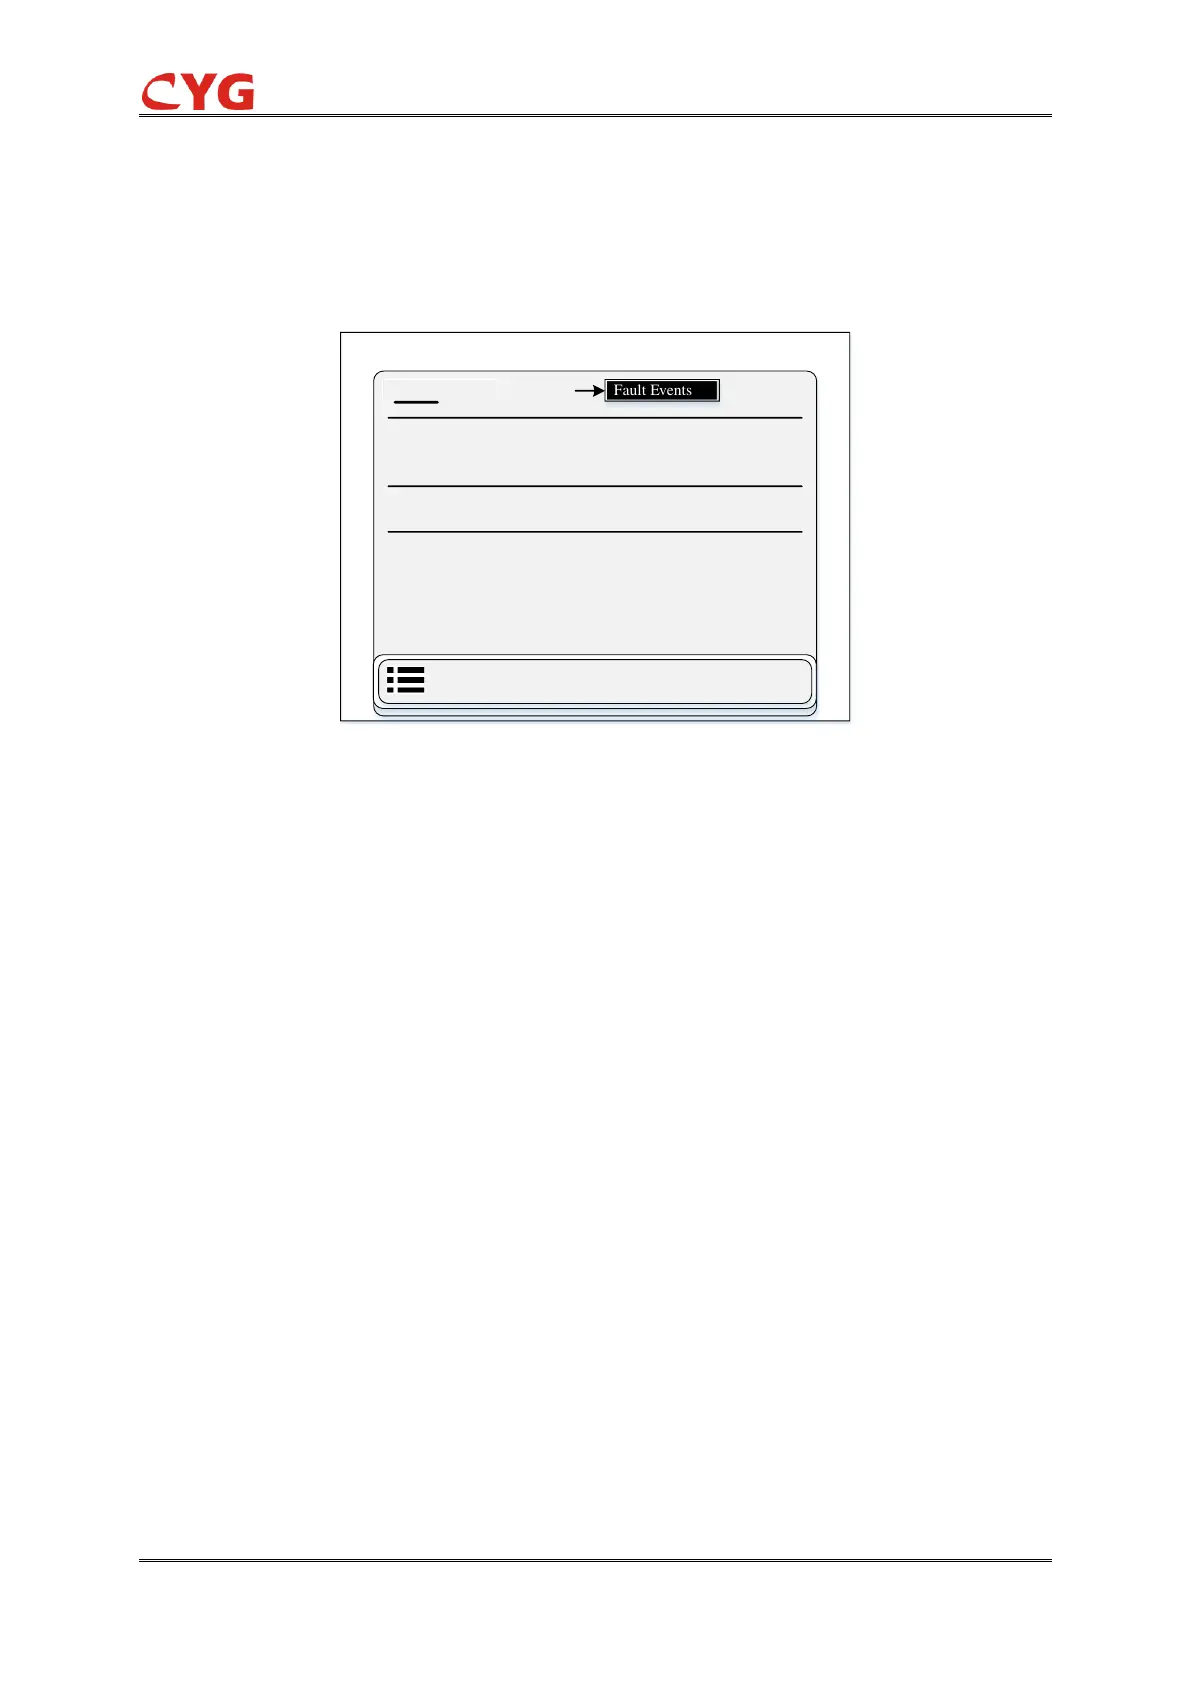
This section divided into one sub-function like fault events and this device can store 1024 latest
protection records. User can access this function through the following path: “Event > Port
Records”. The detail of this section divided into nine points:
1. Shows date and time
2. Protection function status
3. Shows operation of protection function like which protection function is acted.
4. Shows operated phases information
5. Shows fault clearance delay time
6. Shows slot info like management slot (slot3) or protection slot (slot9).
7. Shows fault number
8. Not reverted
9. Shows fault events page number information, it will be increase or decrease w.r.to numbers of
fault.
The diagram of fault event display of relay is listed in below figure 7.3.12:

 Loading...