Sweep Frequency Response Analyzer (SFRA) User Guide
3-10 72A-2570-01 Rev. K 07/2011
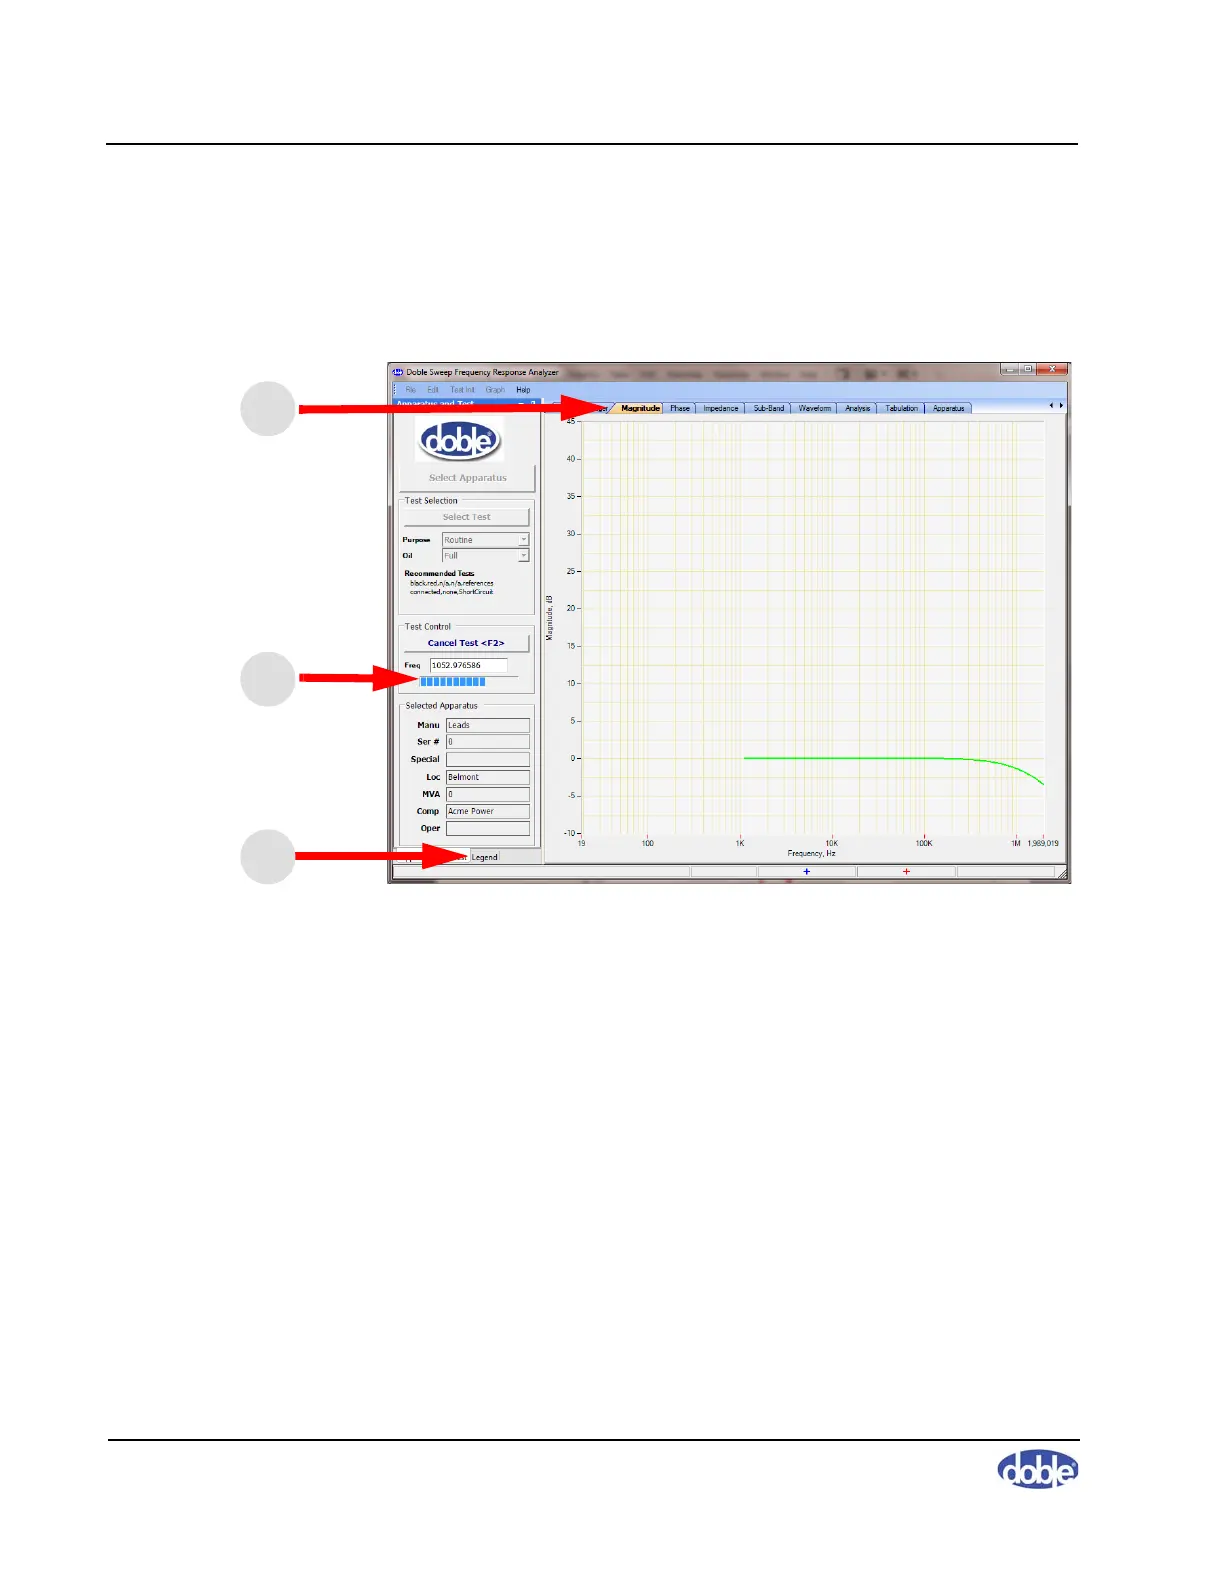
6. Click Run Test.
The Magnitude tab appears (#1 in Figure 3.15) and displays the trace as it
develops. The Legend pane appears (#2) and a progress bar expands as the
test progresses (#3).
Figure 3.15 Shorted-lead Test in Progress
When the test finishes, the view auto-zooms so that the trace takes up most
of the graph. The result should resemble the curve shown in Figure 3.16
on page 3-11.