A. Software Overview
72A-2570-01 Rev. K 07/2011 A-13
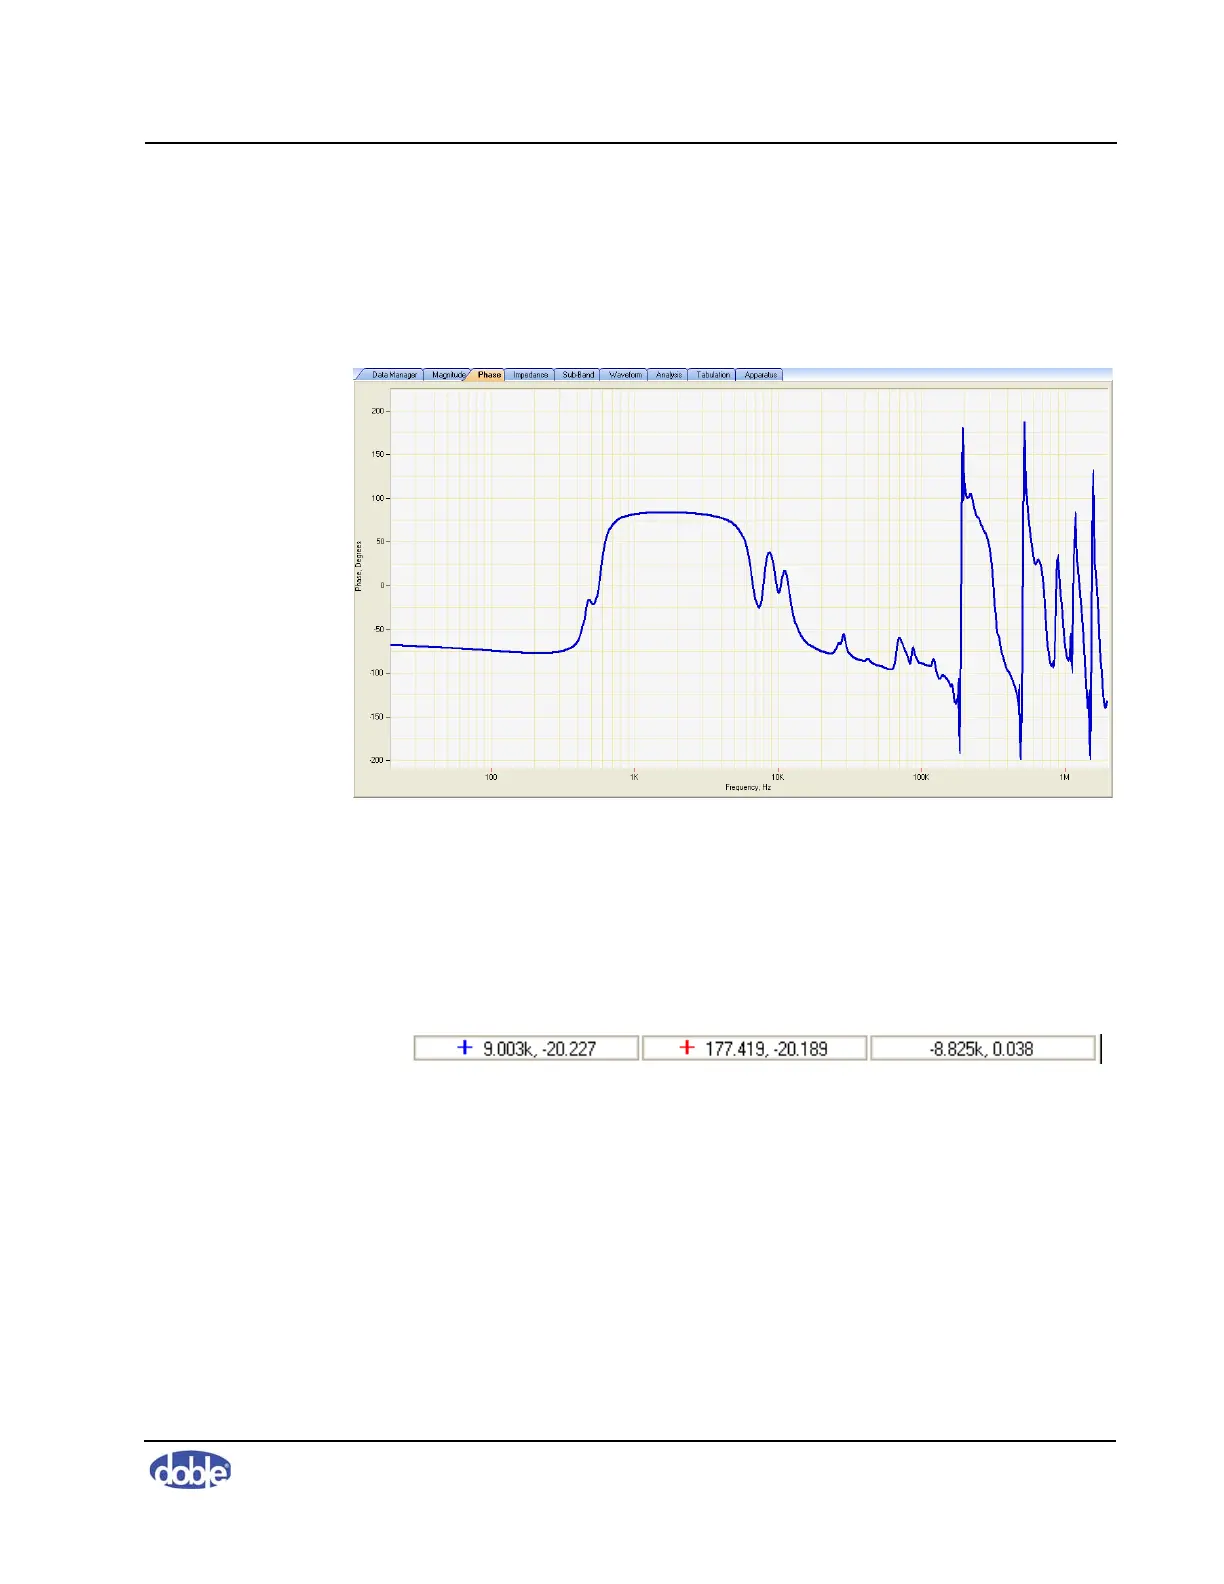
Phase Tab
The Phase tab (Figure A.11) displays phase versus frequency for the selected
graph(s). Phase is rarely used but can occasionally be useful when looking at
whether a measurement is more inductive or more capacitive.
Figure A.11 Phase Tab
Figure A.12 shows the status bar at the bottom of the main screen. The
coordinates reflect the last change you made to the cursor position on any of
the three tabs. Click the blue or red “+” sign to show or hide the cursors. The
field on the right (active only when both are on) displays the difference
between the two.
Figure A.12 Status Bar