Sweep Frequency Response Analyzer (SFRA) User Guide
A-12 72A-2570-01 Rev. K 07/2011
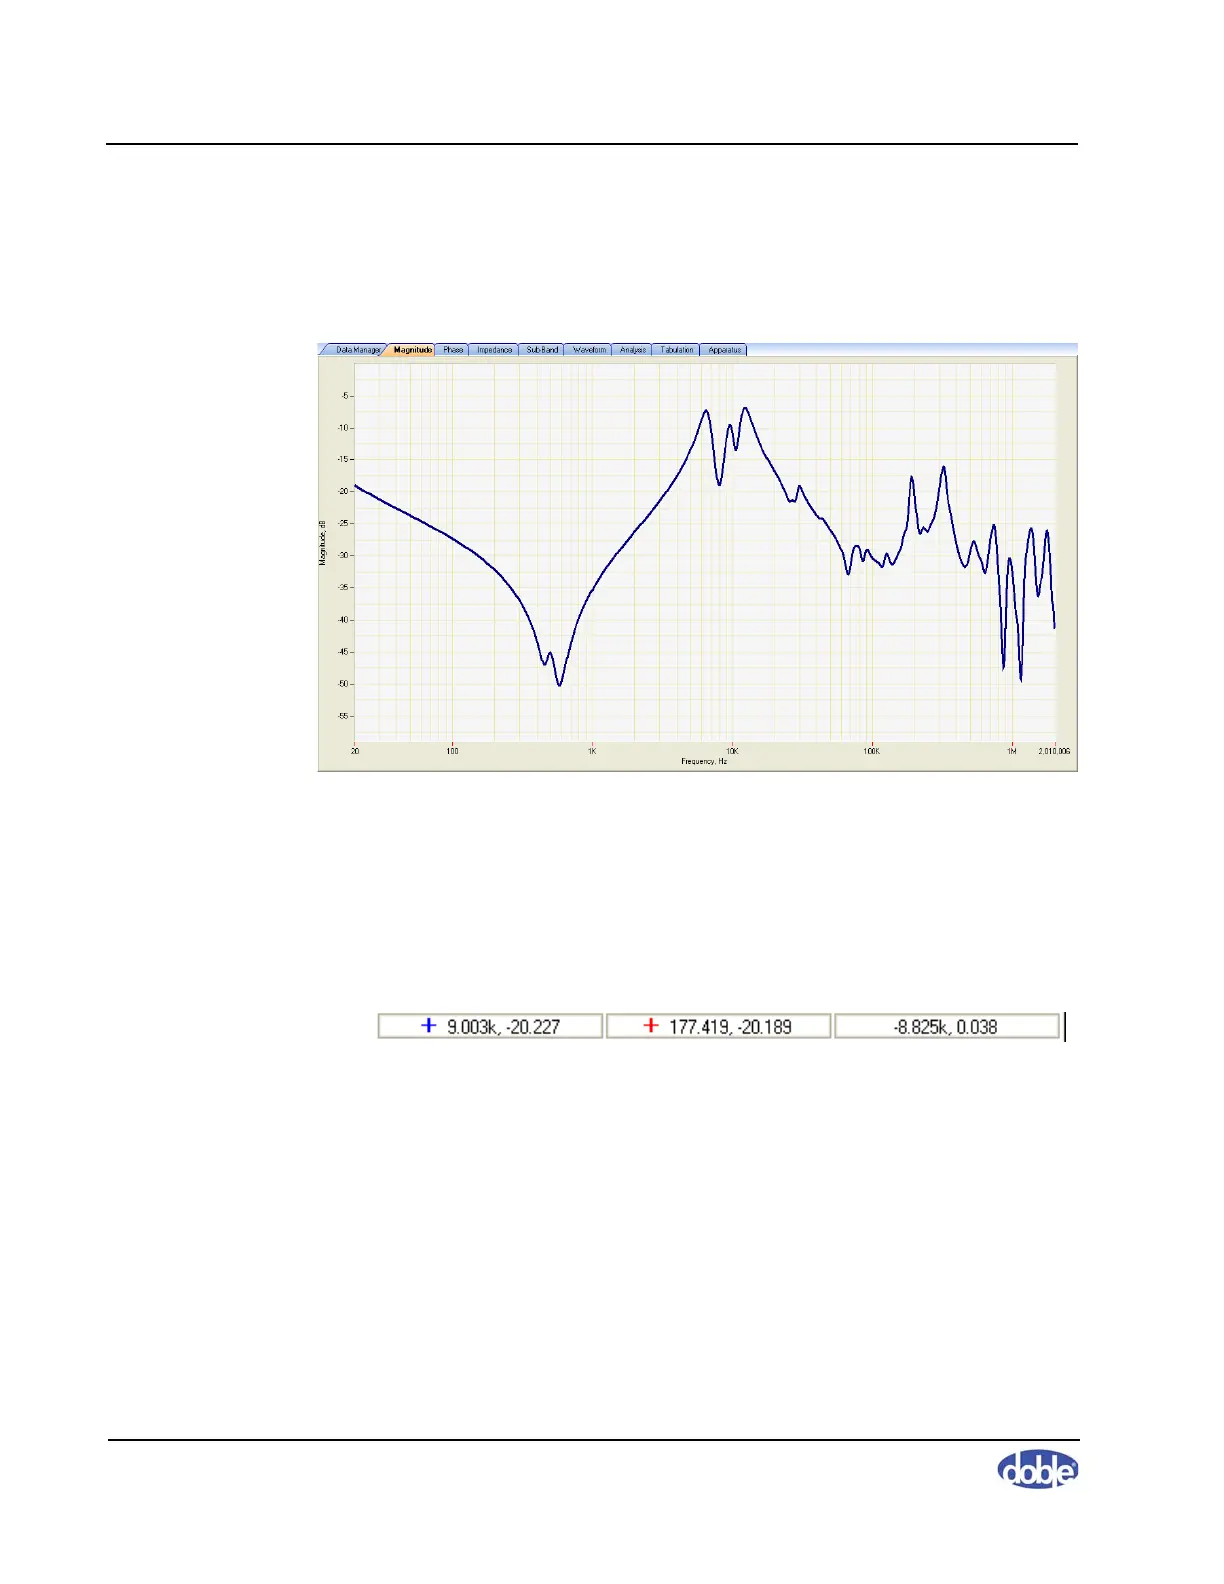
Magnitude Tab
The Magnitude tab (Figure A.9) displays magnitude versus frequency for the
selected graph(s).
Figure A.9 Magnitude Tab
Figure A.10 shows the status bar at the bottom of the main screen. The
coordinates reflect the last change you made to the cursor position on any of
the three tabs. Click the blue or red “+” sign to show or hide the cursors. The
field on the right (active only when both are on) displays the difference
between the two.
Figure A.10 Status Bar