Sweep Frequency Response Analyzer (SFRA) User Guide
A-8 72A-2570-01 Rev. K 07/2011
Zoom Zooms on the graph section between cursor positions.
Both cursors must be visible. Shortcut key: Shift + click.
You can also shift, click, and drag diagonally to create a
rectangle outlining the area you want to zoom on.
Unzoom Resets the graph to the default view.
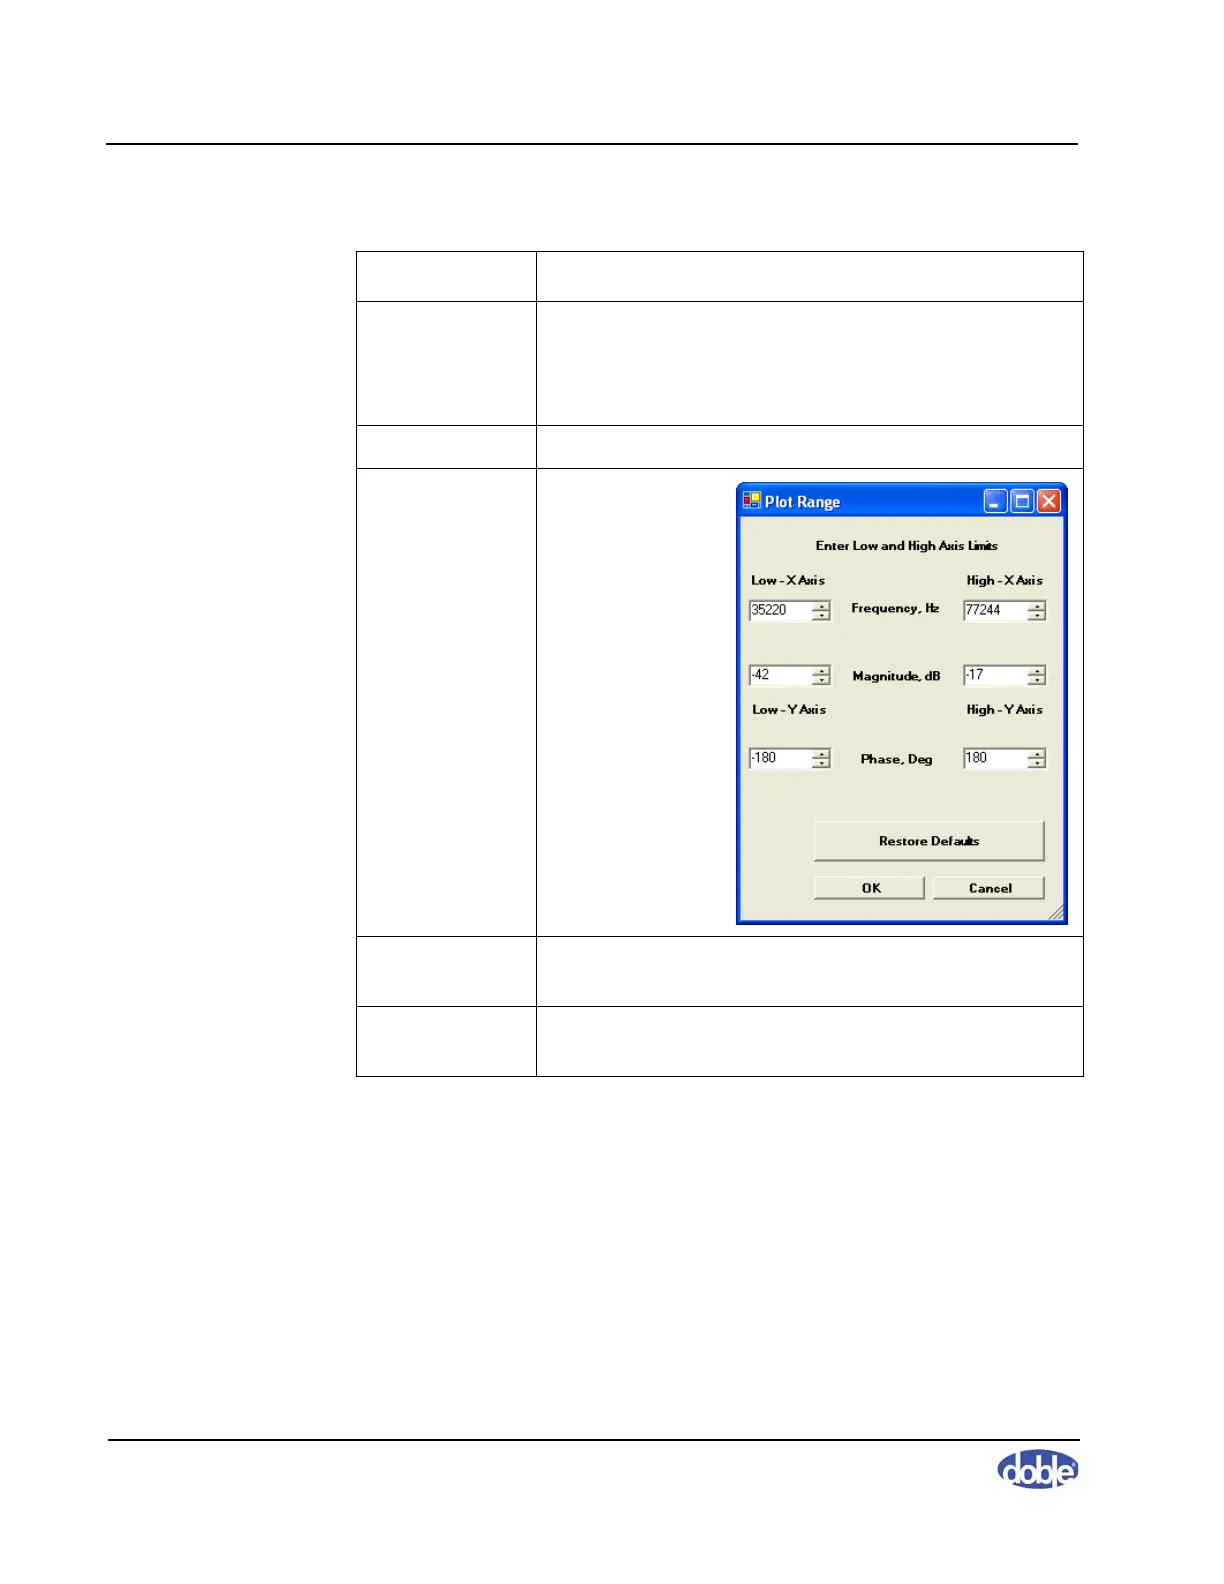
New Range Opens the Plot
Range dialog box,
enabling you to
set the low and
high axis limits.
This is useful
when producing
zoomed plots of
graph areas for
reports.
Log Displays the graph with a log x-axis scale. Typically
emphasizes lower frequencies.
Linear Displays the graph with a linear x-axis scale. Typically
emphasizes higher frequencies.
Table A.4 Graph Menu Options (Continued)
Command Description
 Loading...